Data check: Alcohol consumption in the Scottish Health Survey
Scotland_alcohol_data_report.RmdClick here to go to the Scottish Health Survey data page on the STAPM website
The purpose of this document
To plot the data processed using functions in the hseclean package as part of the process of quality assurance of the preparation of input data used in the alcohol component of the STAPM modelling for Scotland. This document comprises exploratory plots to illustrate the SHeS data on alcohol consumption and plots that we use to check the processing of the data using hseclean.
Background
The Scottish Health Survey (SHeS) is an annual series of surveys of the health and health-related behaviours of private households in Scotland that has been carried out annually since 2008 (and before that in 1995, 1998 and 2003). It is the source of data on alcohol consumption used to inform the alcohol component of the Sheffield Tobacco and Alcohol Policy Modelling. The survey asks respondents about the volume of certain types of drinks bought or consumed over a certain time period. These volumes are then standardised by converting them into alcohol units (one UK standard unit = 10ml of pure ethanol). The conversion of reported volumes to units is based on assumptions about the average alcohol content (ABV) of different types of drink.
It is generally accepted that this self-reported data underestimates actual consumption by as much as 50% (Stockwell et al. 2004). This data check does not investigate the magnitude of such underestimation or the potential biases introduced.
The Scottish Health Survey estimates alcohol consumption for people age 16 and over. Participants who reported that they drank were asked how often during the past 12 months they had drink each of six different types of alcoholic drink:
- normal beer, lager, stout, cider and shandy
- strong beer, lager, stout and cider
- sherry and Martini
- spirits and liqueurs
- wine
- alcoholic soft drinks (alcopops)
From these questions, the average number of days per week the participant had drunk was estimated. A further question then asks how much of each drink type they had usually drunk on each occasion.
The main report for the Scottish Health Survey 2018 volume 1 (McLean et al. 2018) gives the conversion factors used to convert the quantity-frequency survey questions into estimated units of average weekly alcohol consumption.
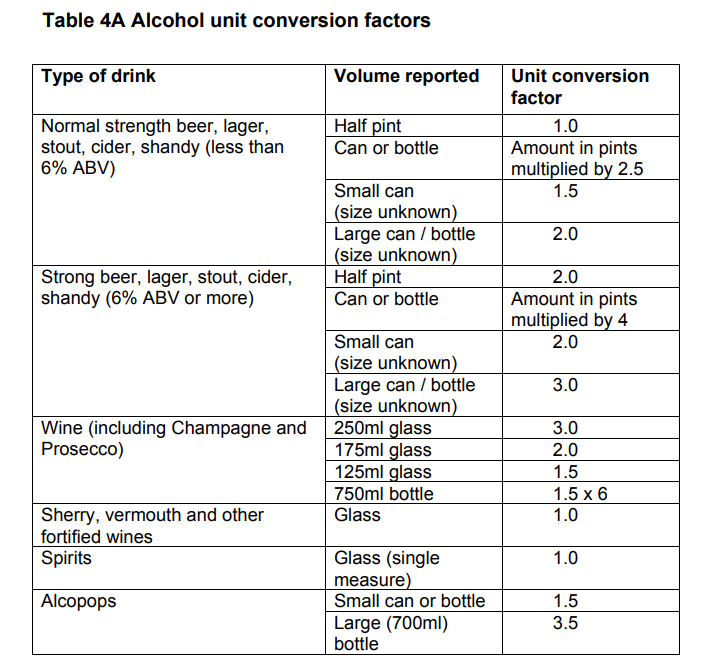
Table 1. Excerpt from Section 3.2.3 p 78 of the main report volume 1 of the Scottish Health Survey 2018.
The SHeS data is processed for use in the STAPM modelling by standardised and version controlled R code functions in the hseclean R package. Project specific code draws on these functions to process the SHeS data into STAPM inputs.
Someone is classed as a current drinker if they reported drinking at all in the last 12 months e.g. even if reporting only having 1-2 drinks a year. There is no alcohol data collected for children, therefore we retain under 16s in our data, but assign them ‘NA’ for all alcohol questions. Any missing data is supplemented by responses to if currently drinks or if always non-drinker.
The hseclean method applies different assumptions to those used by the providers of the SHeS data to convert the quantity-frequency survey questions into estimated units of average weekly alcohol consumption. The method in hseclean is based on the method used in the 2014 report by the Sheffield Alcohol Research Group on the potential impacts of alcohol minimum unit pricing in Scotland (Angus et al. 2016). One of the jobs of this data check is to compare between the hseclean and SHeS methods.
In the current version of hseclean, the percentage alcohol by volume (ABV) estimates used are:
- 4.4% for normal beer, lager, stout, cider and shandy
- 8.4% for strong beer, lager, stout and cider
- 17% for sherry and martini
- 38% for spirits and liqueurs
- 12.5% for wine
- 4.5% for alcoholic soft drinks (alcopops)
These assumptions are used in conjunction with the following assumptions about the volumes (ml) of different types of alcoholic drink:
- normal beer, lager, stout, cider and shandy: half pint 284ml, small can 330ml, large can 440ml, bottle 330ml
- strong beer, lager, stout and cider: half pint 284ml, small can 330ml, large can 440ml, bottle 330ml
- sherry and martini: serving 50ml
- spirits and liqueurs: serving 25ml
- wine: small glass 125ml, standard glass 175ml, large glass 250ml, bottle 750ml
- alcoholic soft drinks (alcopops): small can 250ml, small bottle 275ml, large bottle 700ml
Data checks conducted
Data checks are conducted on a pooled sample of all calendar years of the SHeS data from 2008 to 2019. Survey weights are not applied, i.e. the plots show the distribution of alcohol consumption in the survey sample rather than applying weights to adjust for survey design or non-response rates.
Distribution of average weekly alcohol consumption
- Distribution of average weekly alcohol consumption (UK standard units) calculated from hseclean for (a) the overall population aged 16 to 89 years, (b) by sex, (c) by Scottish Index of Multiple Deprivation quintiles
- Plot of the hseclean version of average weekly alcohol consumption compared to the version provided with the SHeS data (based on different assumptions)
Calendar year trends in average weekly alcohol consumption
- Calendar year trend in the proportion of people who consume alcohol for (a) the overall population aged 16 to 89 years, (b) by sex, (c) by Scottish Index of Multiple Deprivation quintiles
- Calendar year trend in average weekly alcohol consumption by people who consume alcohol for (a) the overall population aged 16 to 89 years, (b) by sex, (c) by Scottish Index of Multiple Deprivation quintiles
Age trends in average weekly alcohol consumption
- Age trend in the proportion of people who consume alcohol for (a) the overall population aged 16 to 89 years, (b) by sex, (c) by Scottish Index of Multiple Deprivation quintiles
- Age trend in average weekly alcohol consumption for (a) the overall population aged 16 to 89 years, (b) by sex, (c) by Scottish Index of Multiple Deprivation quintiles
Alcohol beverage preferences
- Preferences for beer, wine, spirits and alcopops for (a) the overall population aged 16 to 89 years, (b) by sex, (c) by Scottish Index of Multiple Deprivation quintiles
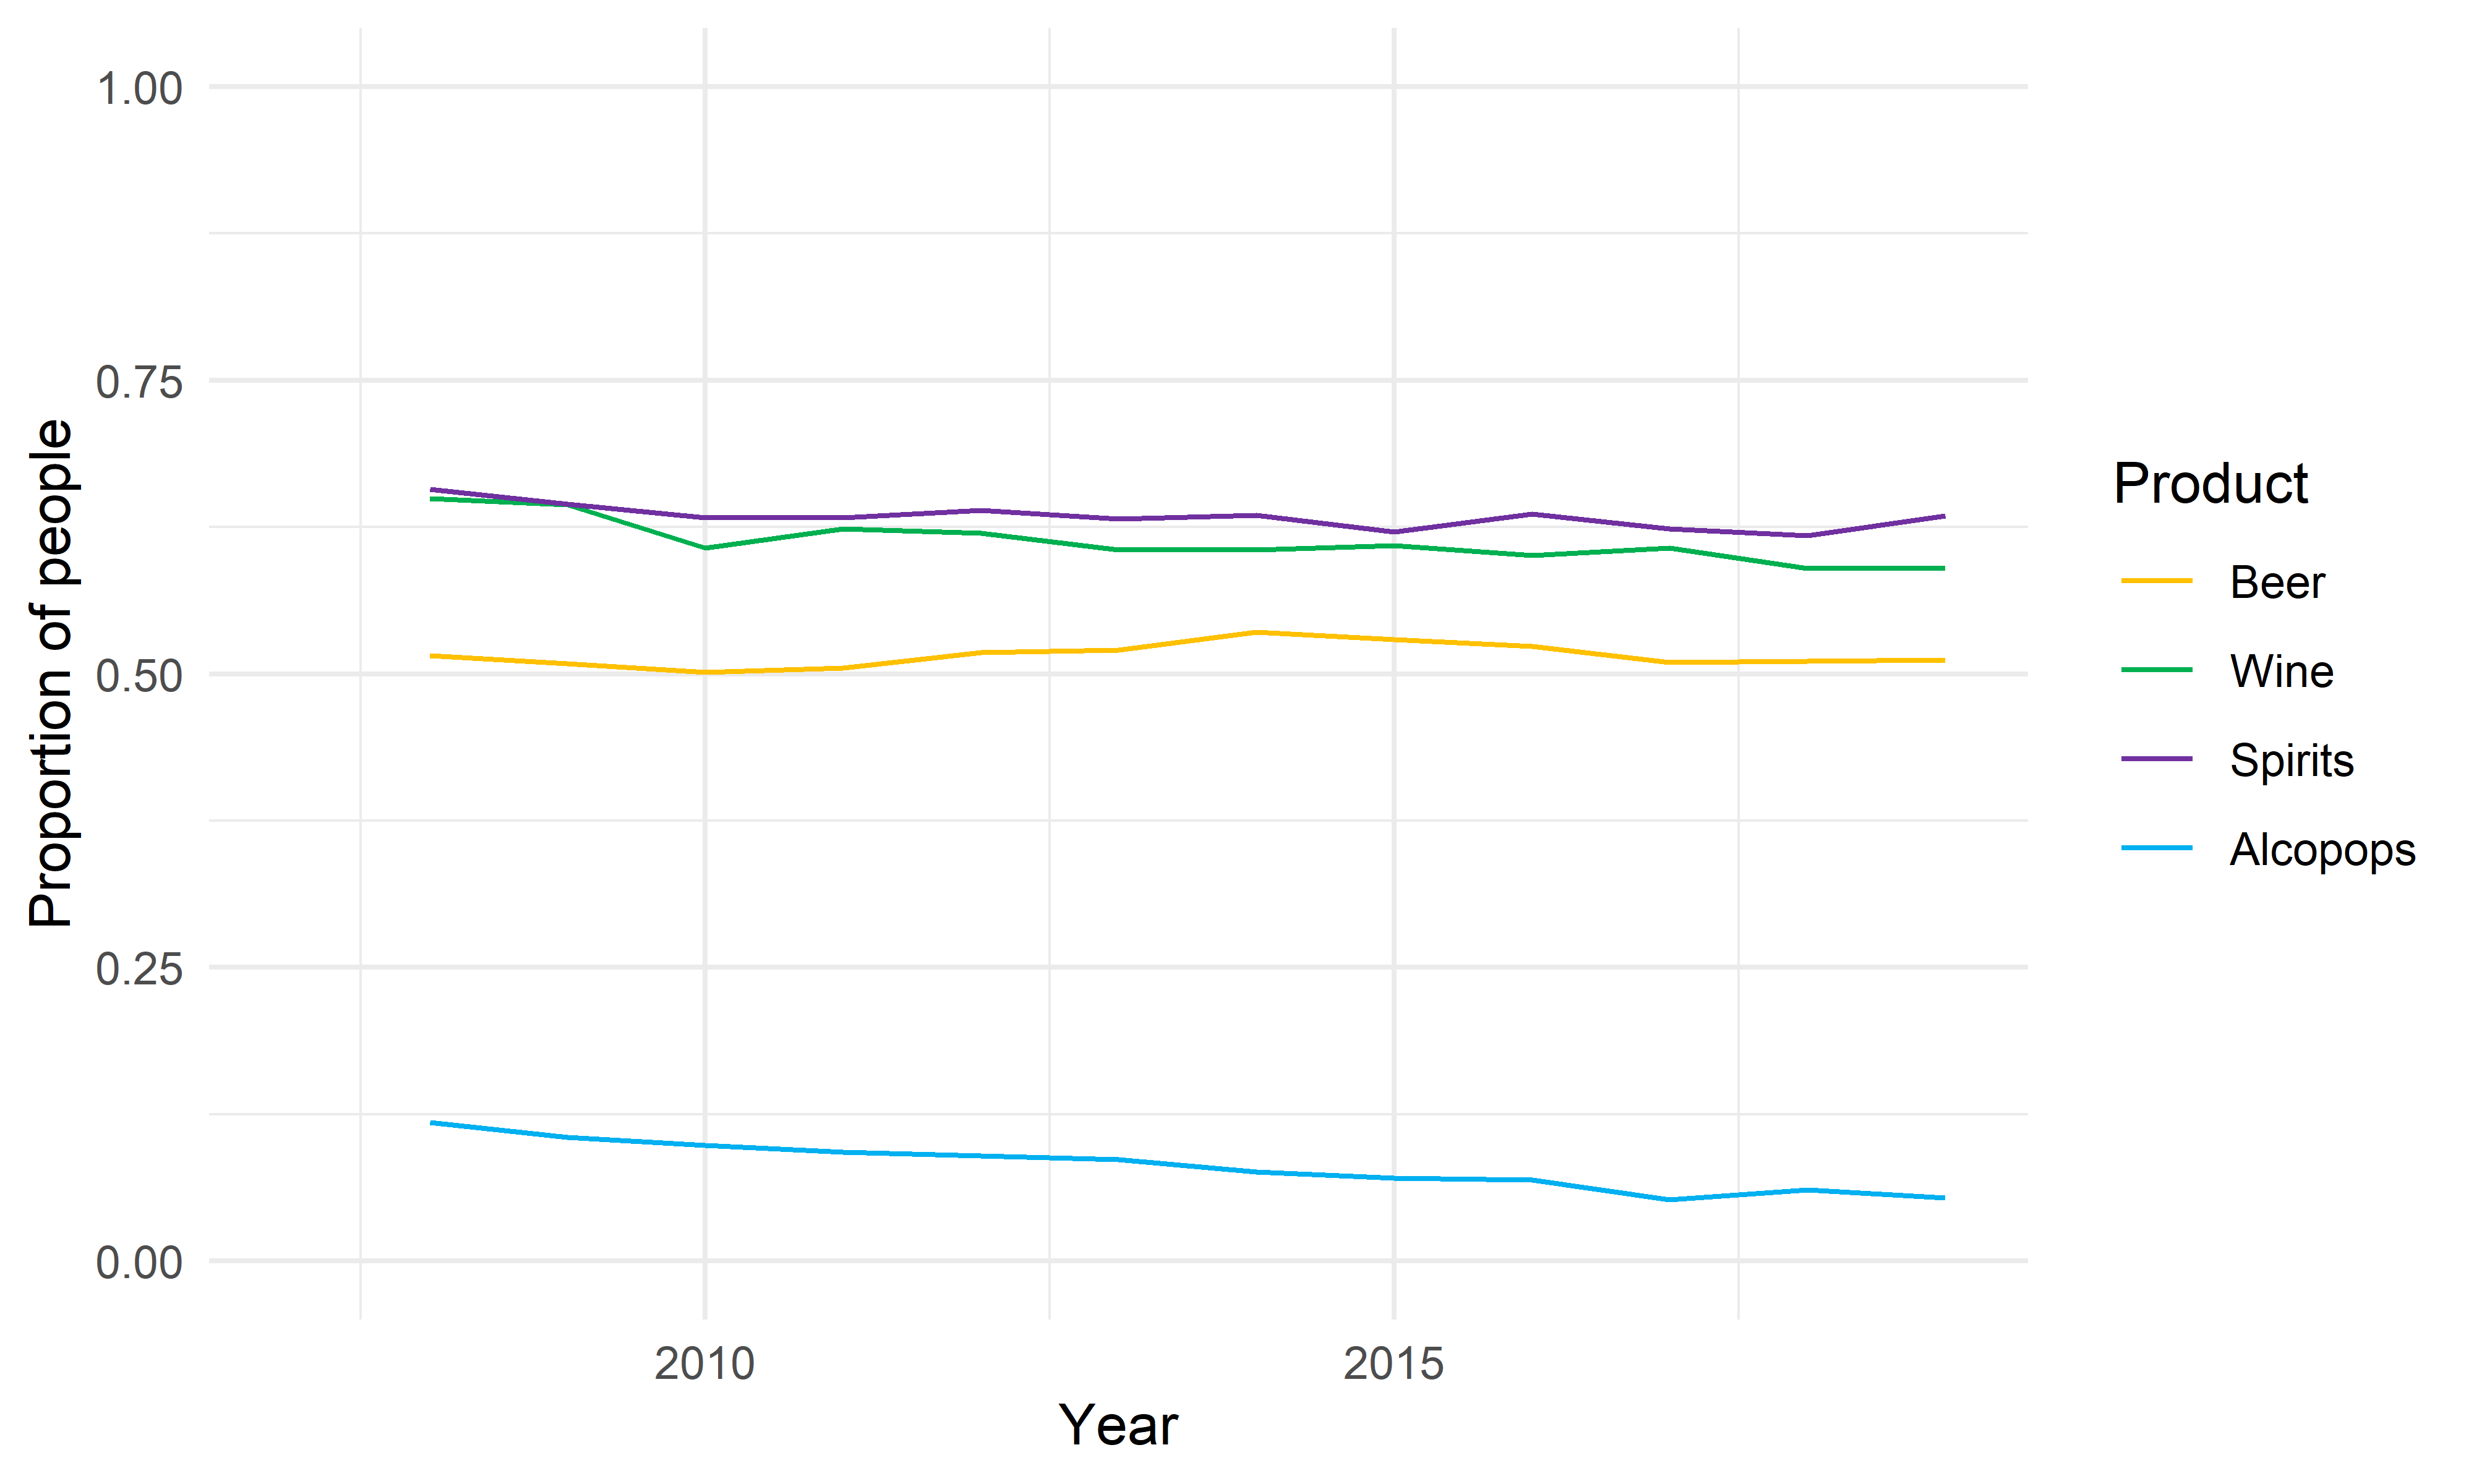
- Calendar year trend in preferences for beer, wine, spirits and alcopops for the overall population aged 16 to 89 years
- Age trend in preferences for beer, wine, spirits and alcopops for the overall population aged 16 to 89 years
Distribution of average weekly alcohol consumption
Histograms
These plots show average weekly alcohol consumption in UK standard units of ethanol. They are based on the pooled SHeS sample from 2008 to 2018. For the purposes of these histograms, the upper limit for the amount consumed is set at 100 units/week.
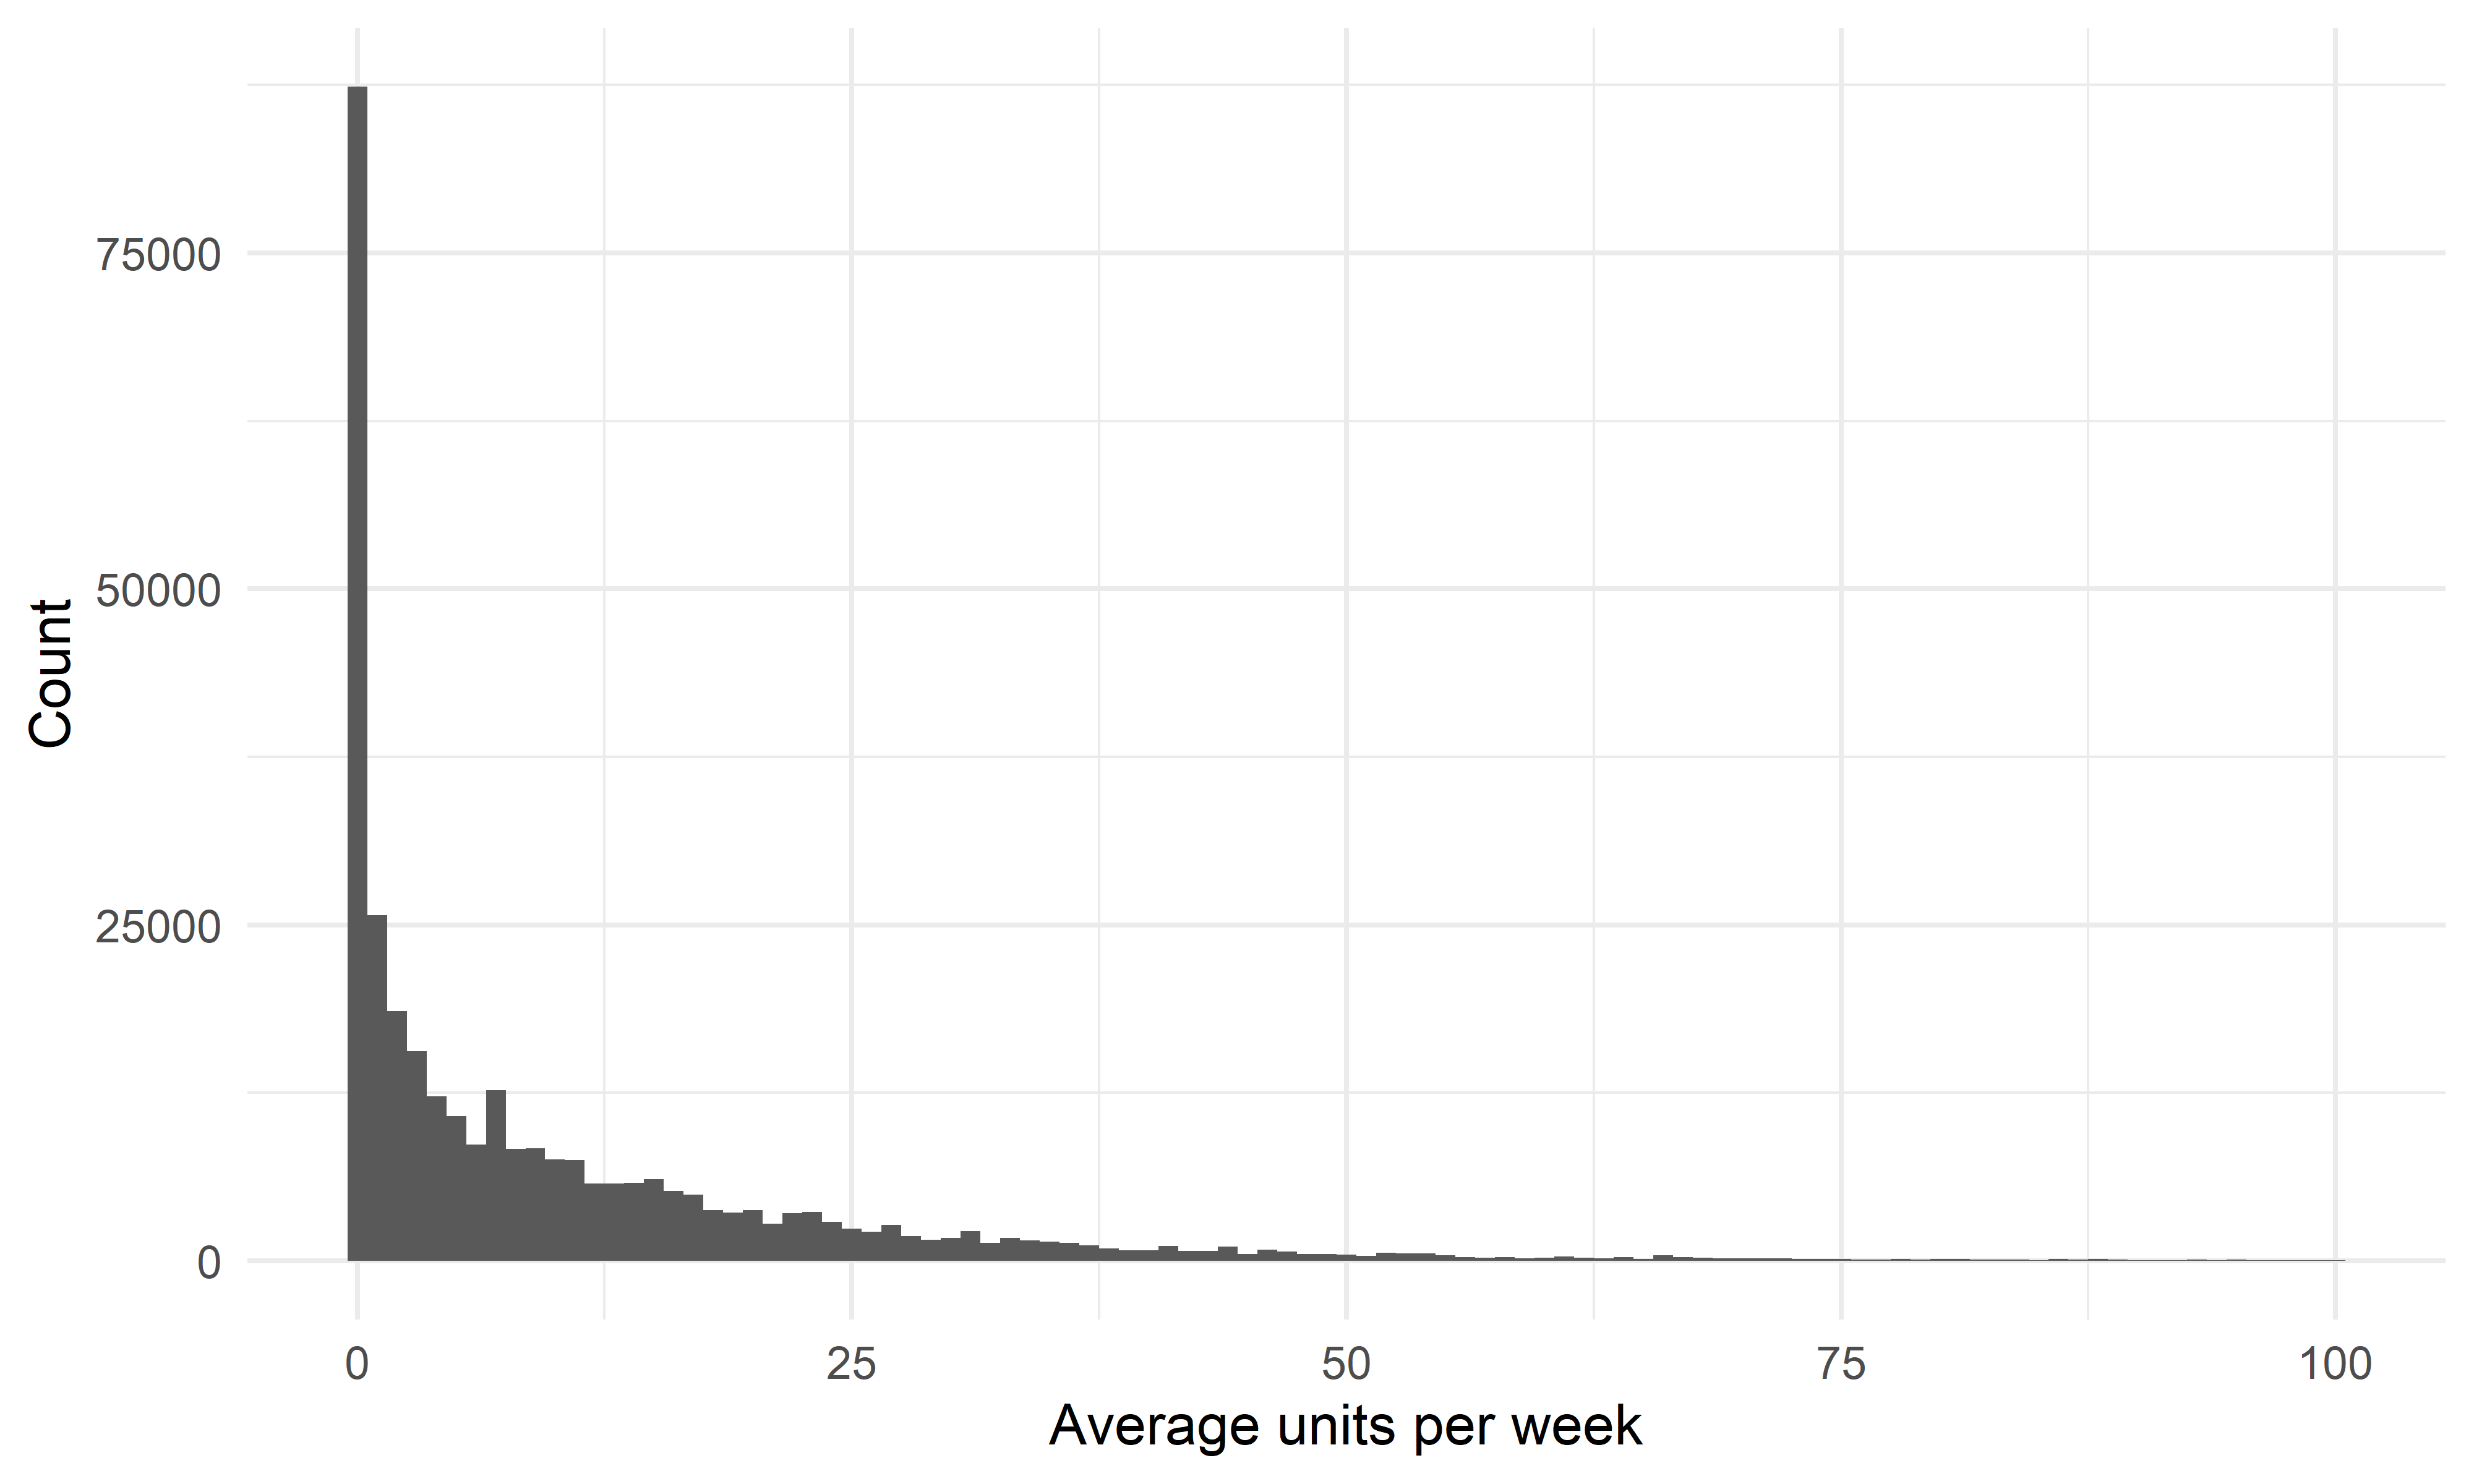
Figure 1. Distribution of average weekly alcohol consumption calculated from hseclean.
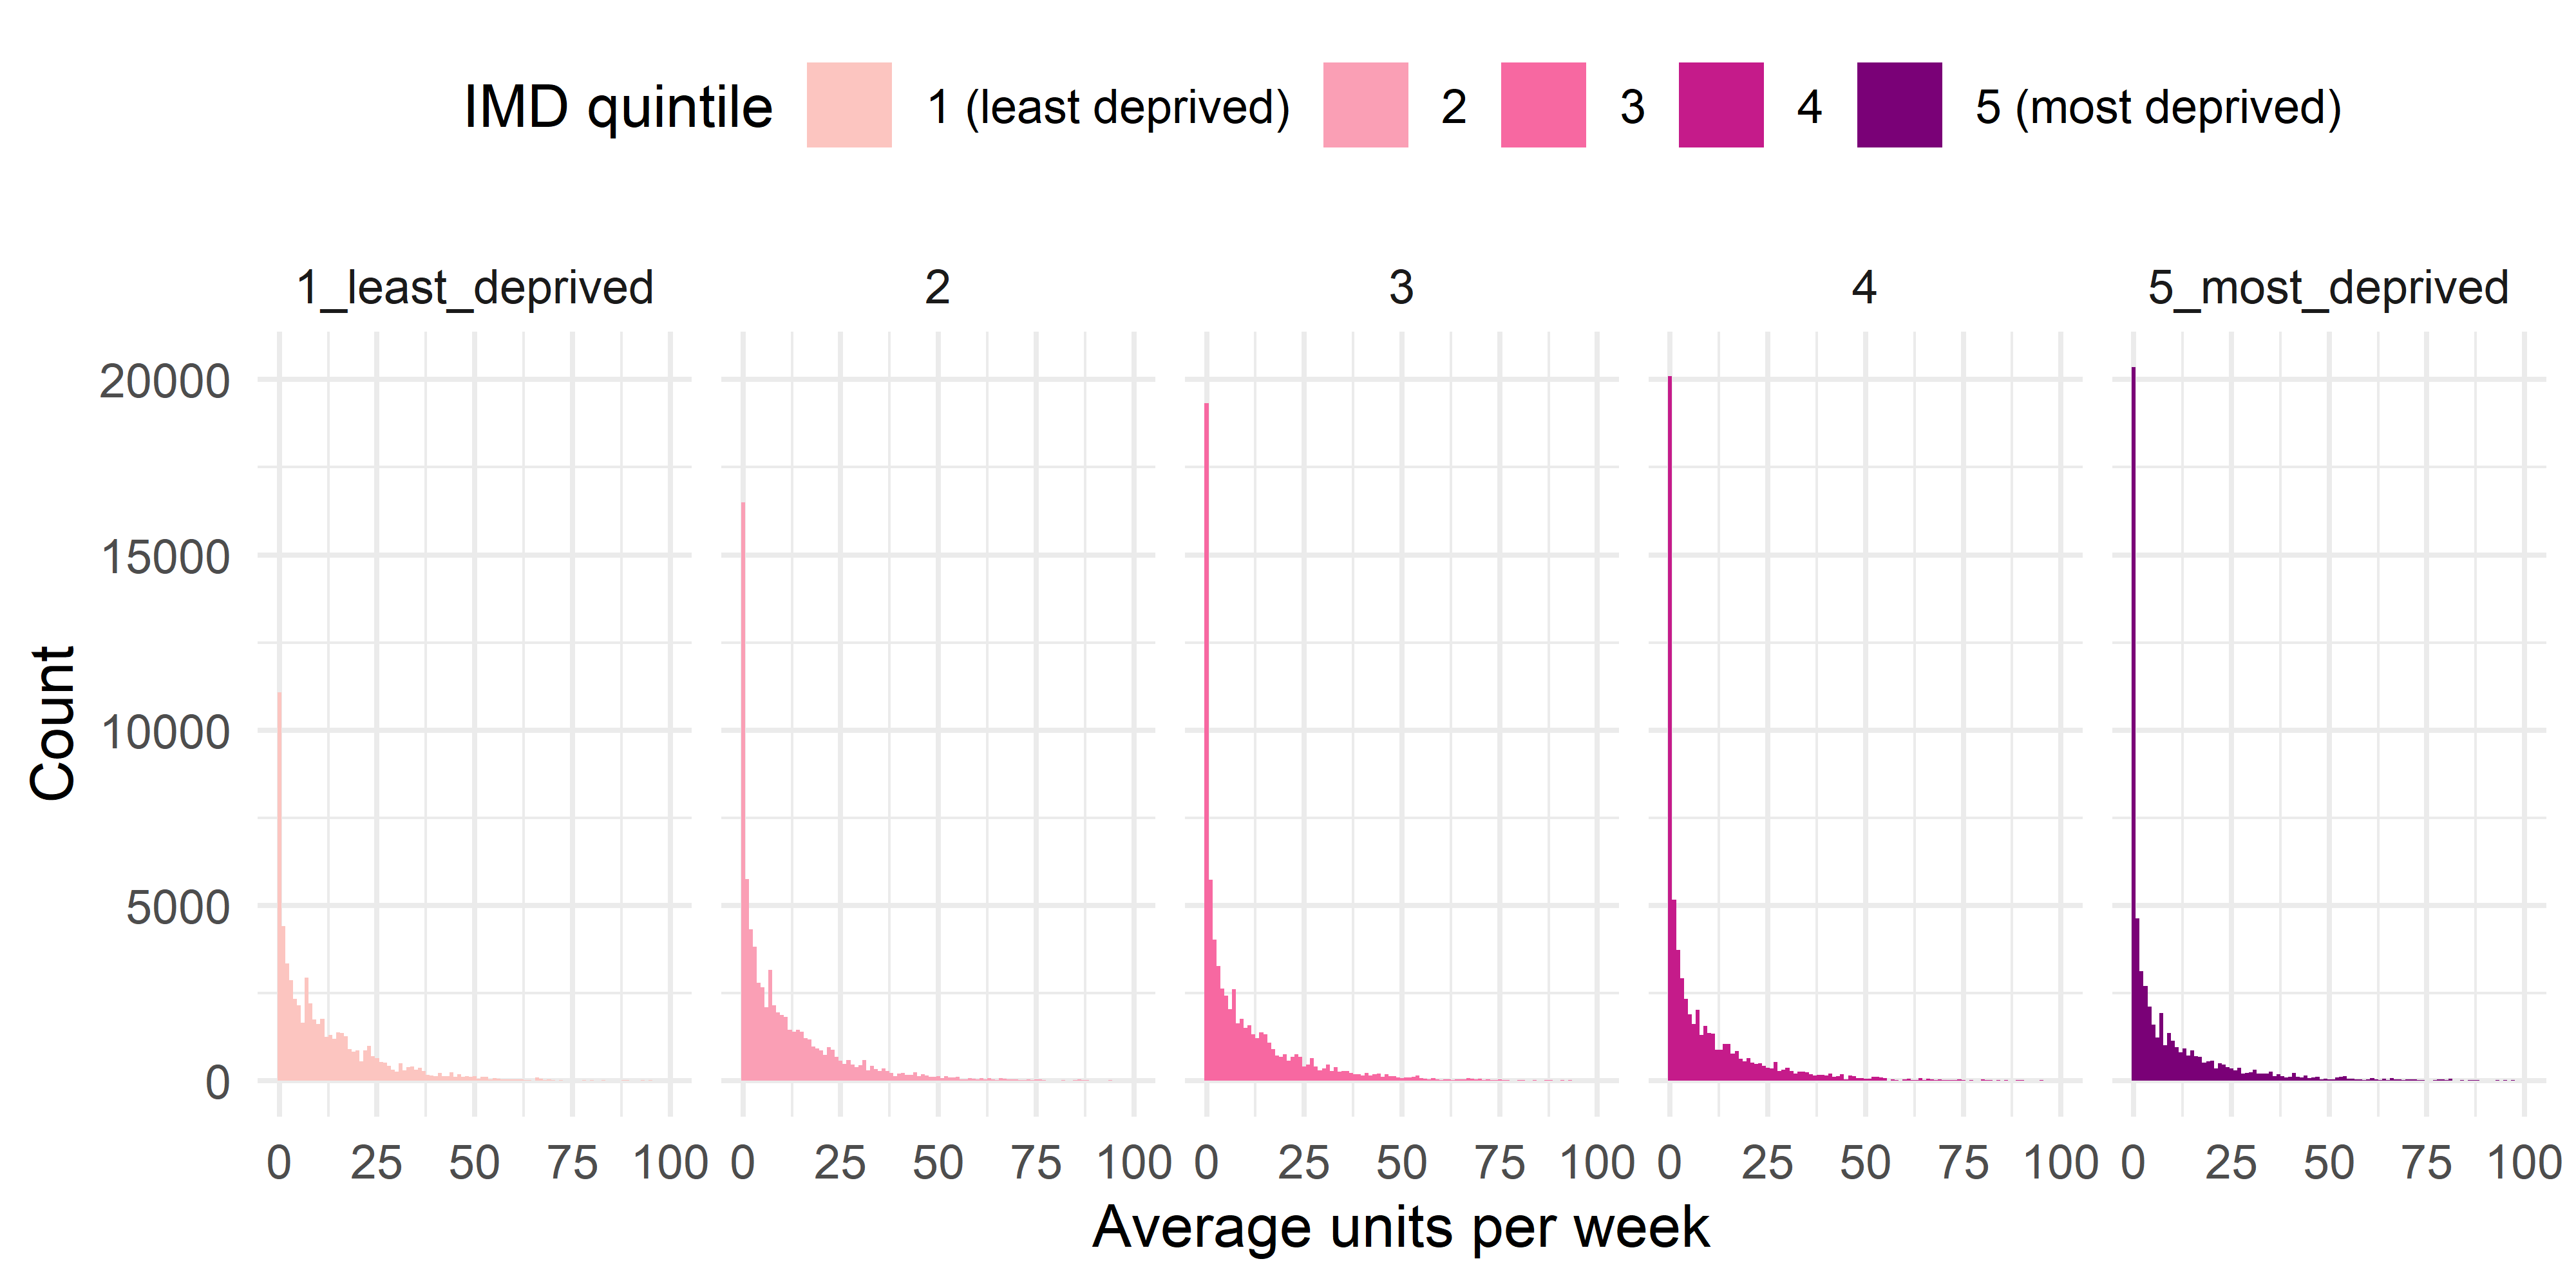
Figure 2. Index of Multiple Deprivation quintile specific distribution of average weekly alcohol consumption calculated from hseclean.
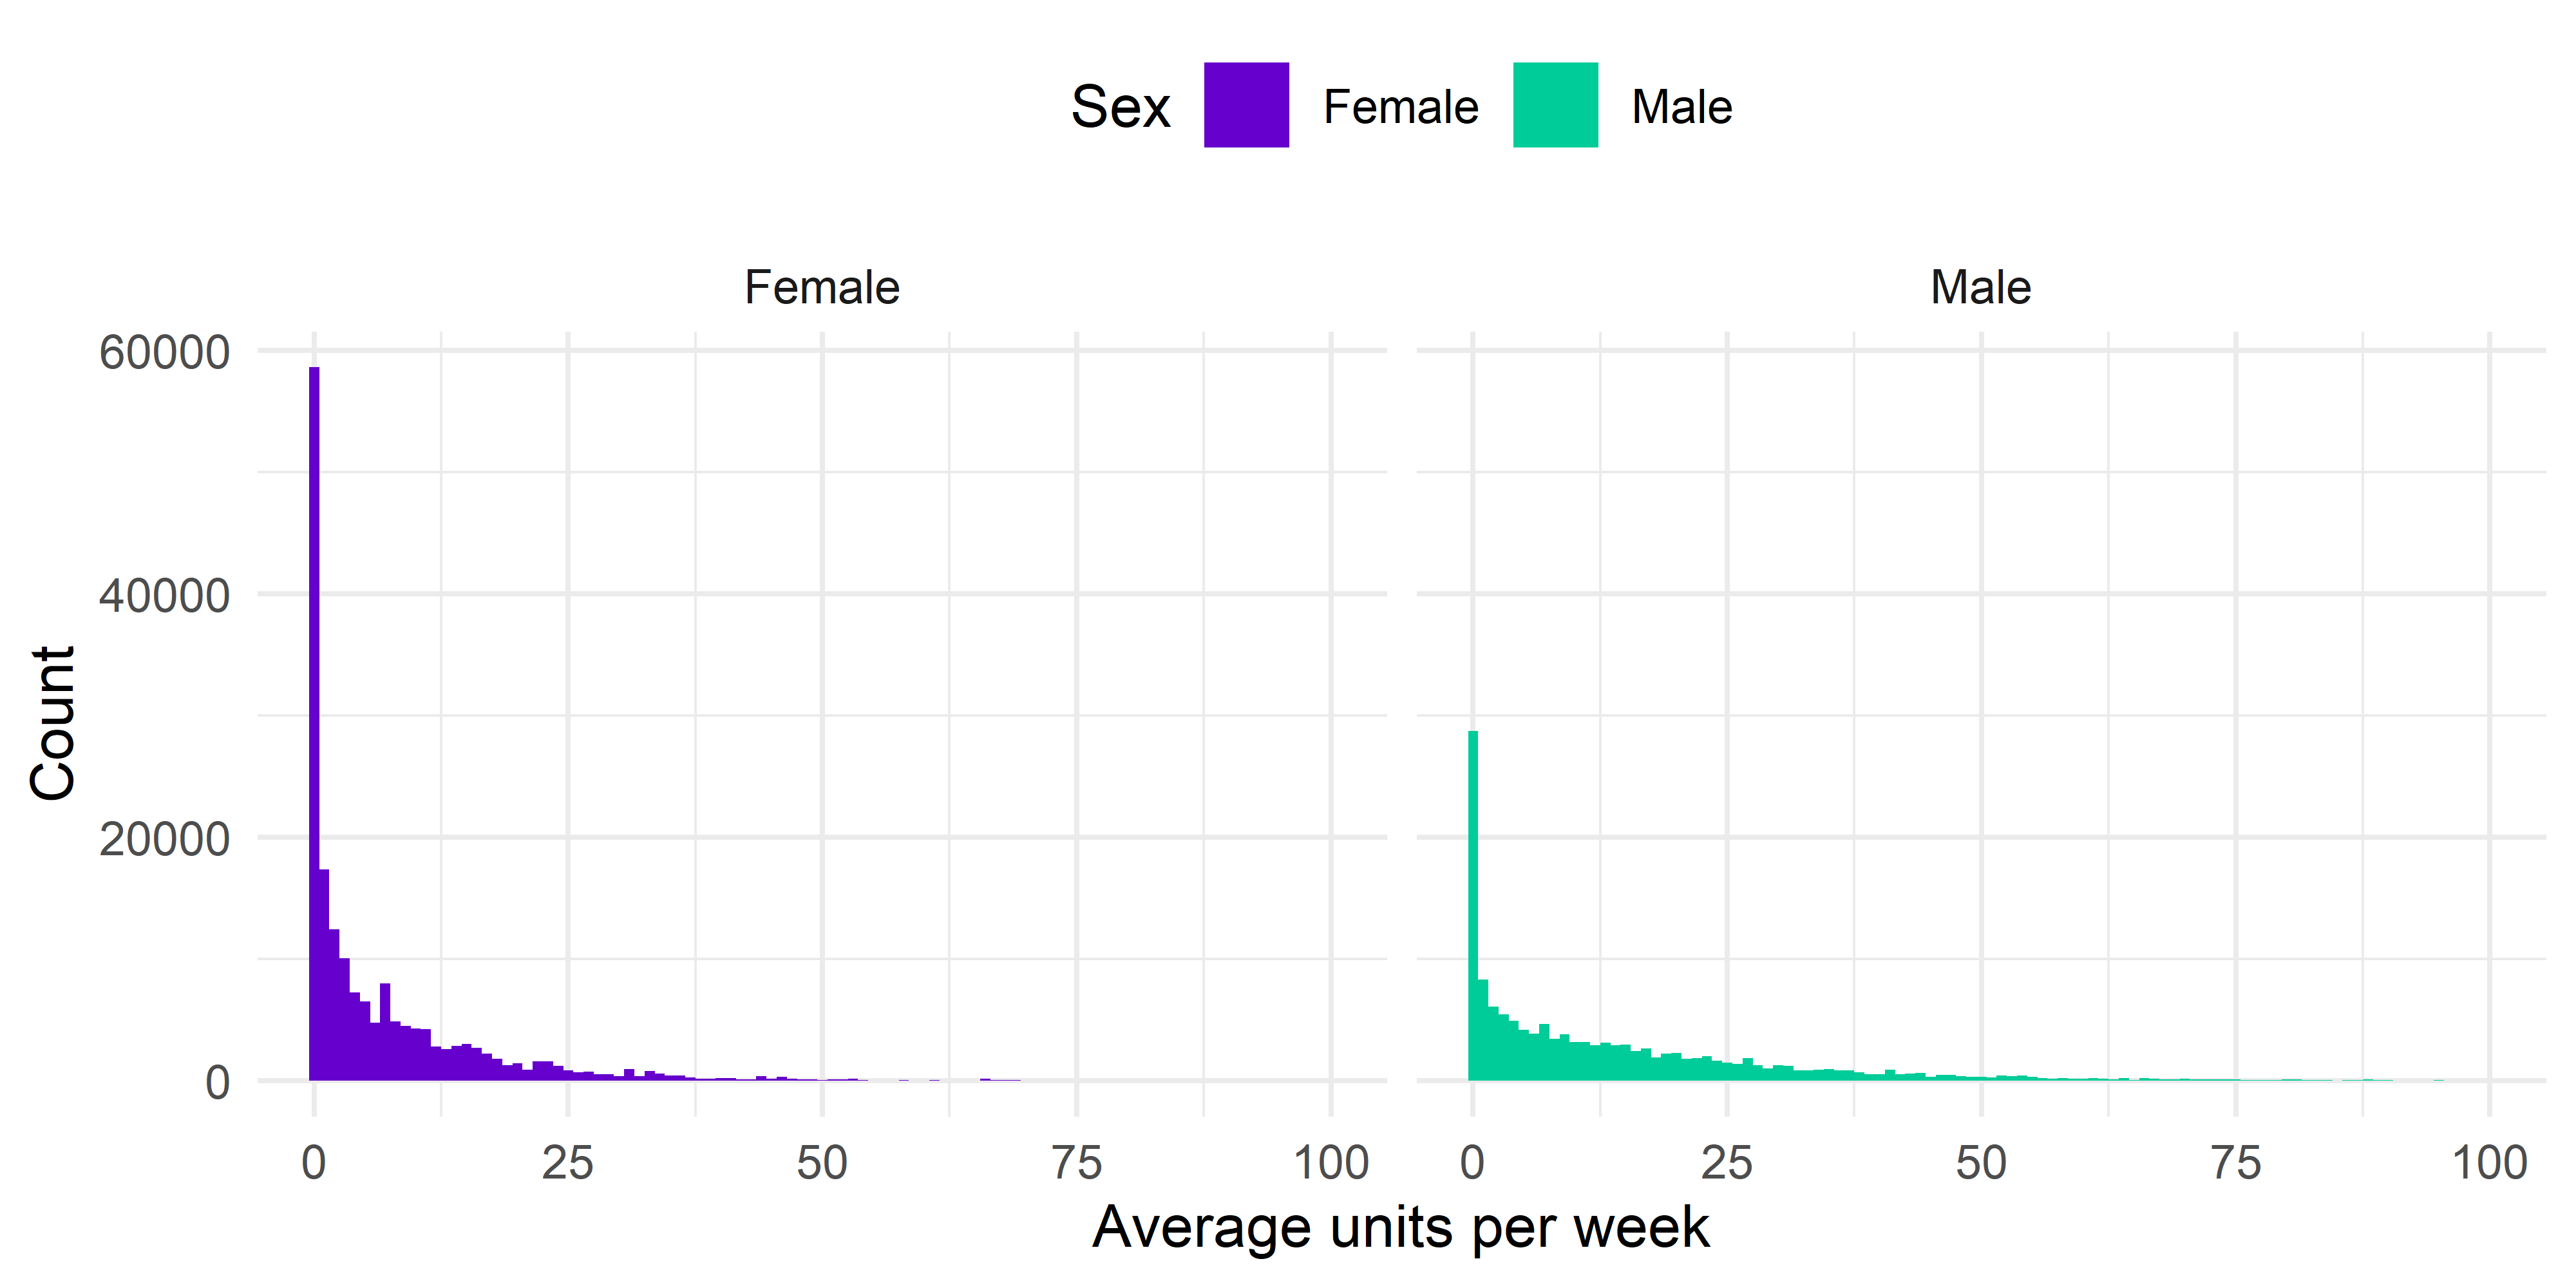
Figure 3. Sex specific distribution of average weekly alcohol consumption calculated from hseclean.
SHeS vs. hseclean calculation of average weekly alcohol consumption
The plots below investigate the differences between two different versions of the calculations of the average weekly alcohol consumption variable. The check uses the pooled data from 2008 to 2019.
The SHeS and hseclean methods use different assumptions about the volume of alcoholic beverages and the percentage alcohol by volume - see details above. Despite the different assumptions used, the validation check should confirm that the two methods produce approximately the same estimates of the average weekly amount of alcohol consumed.
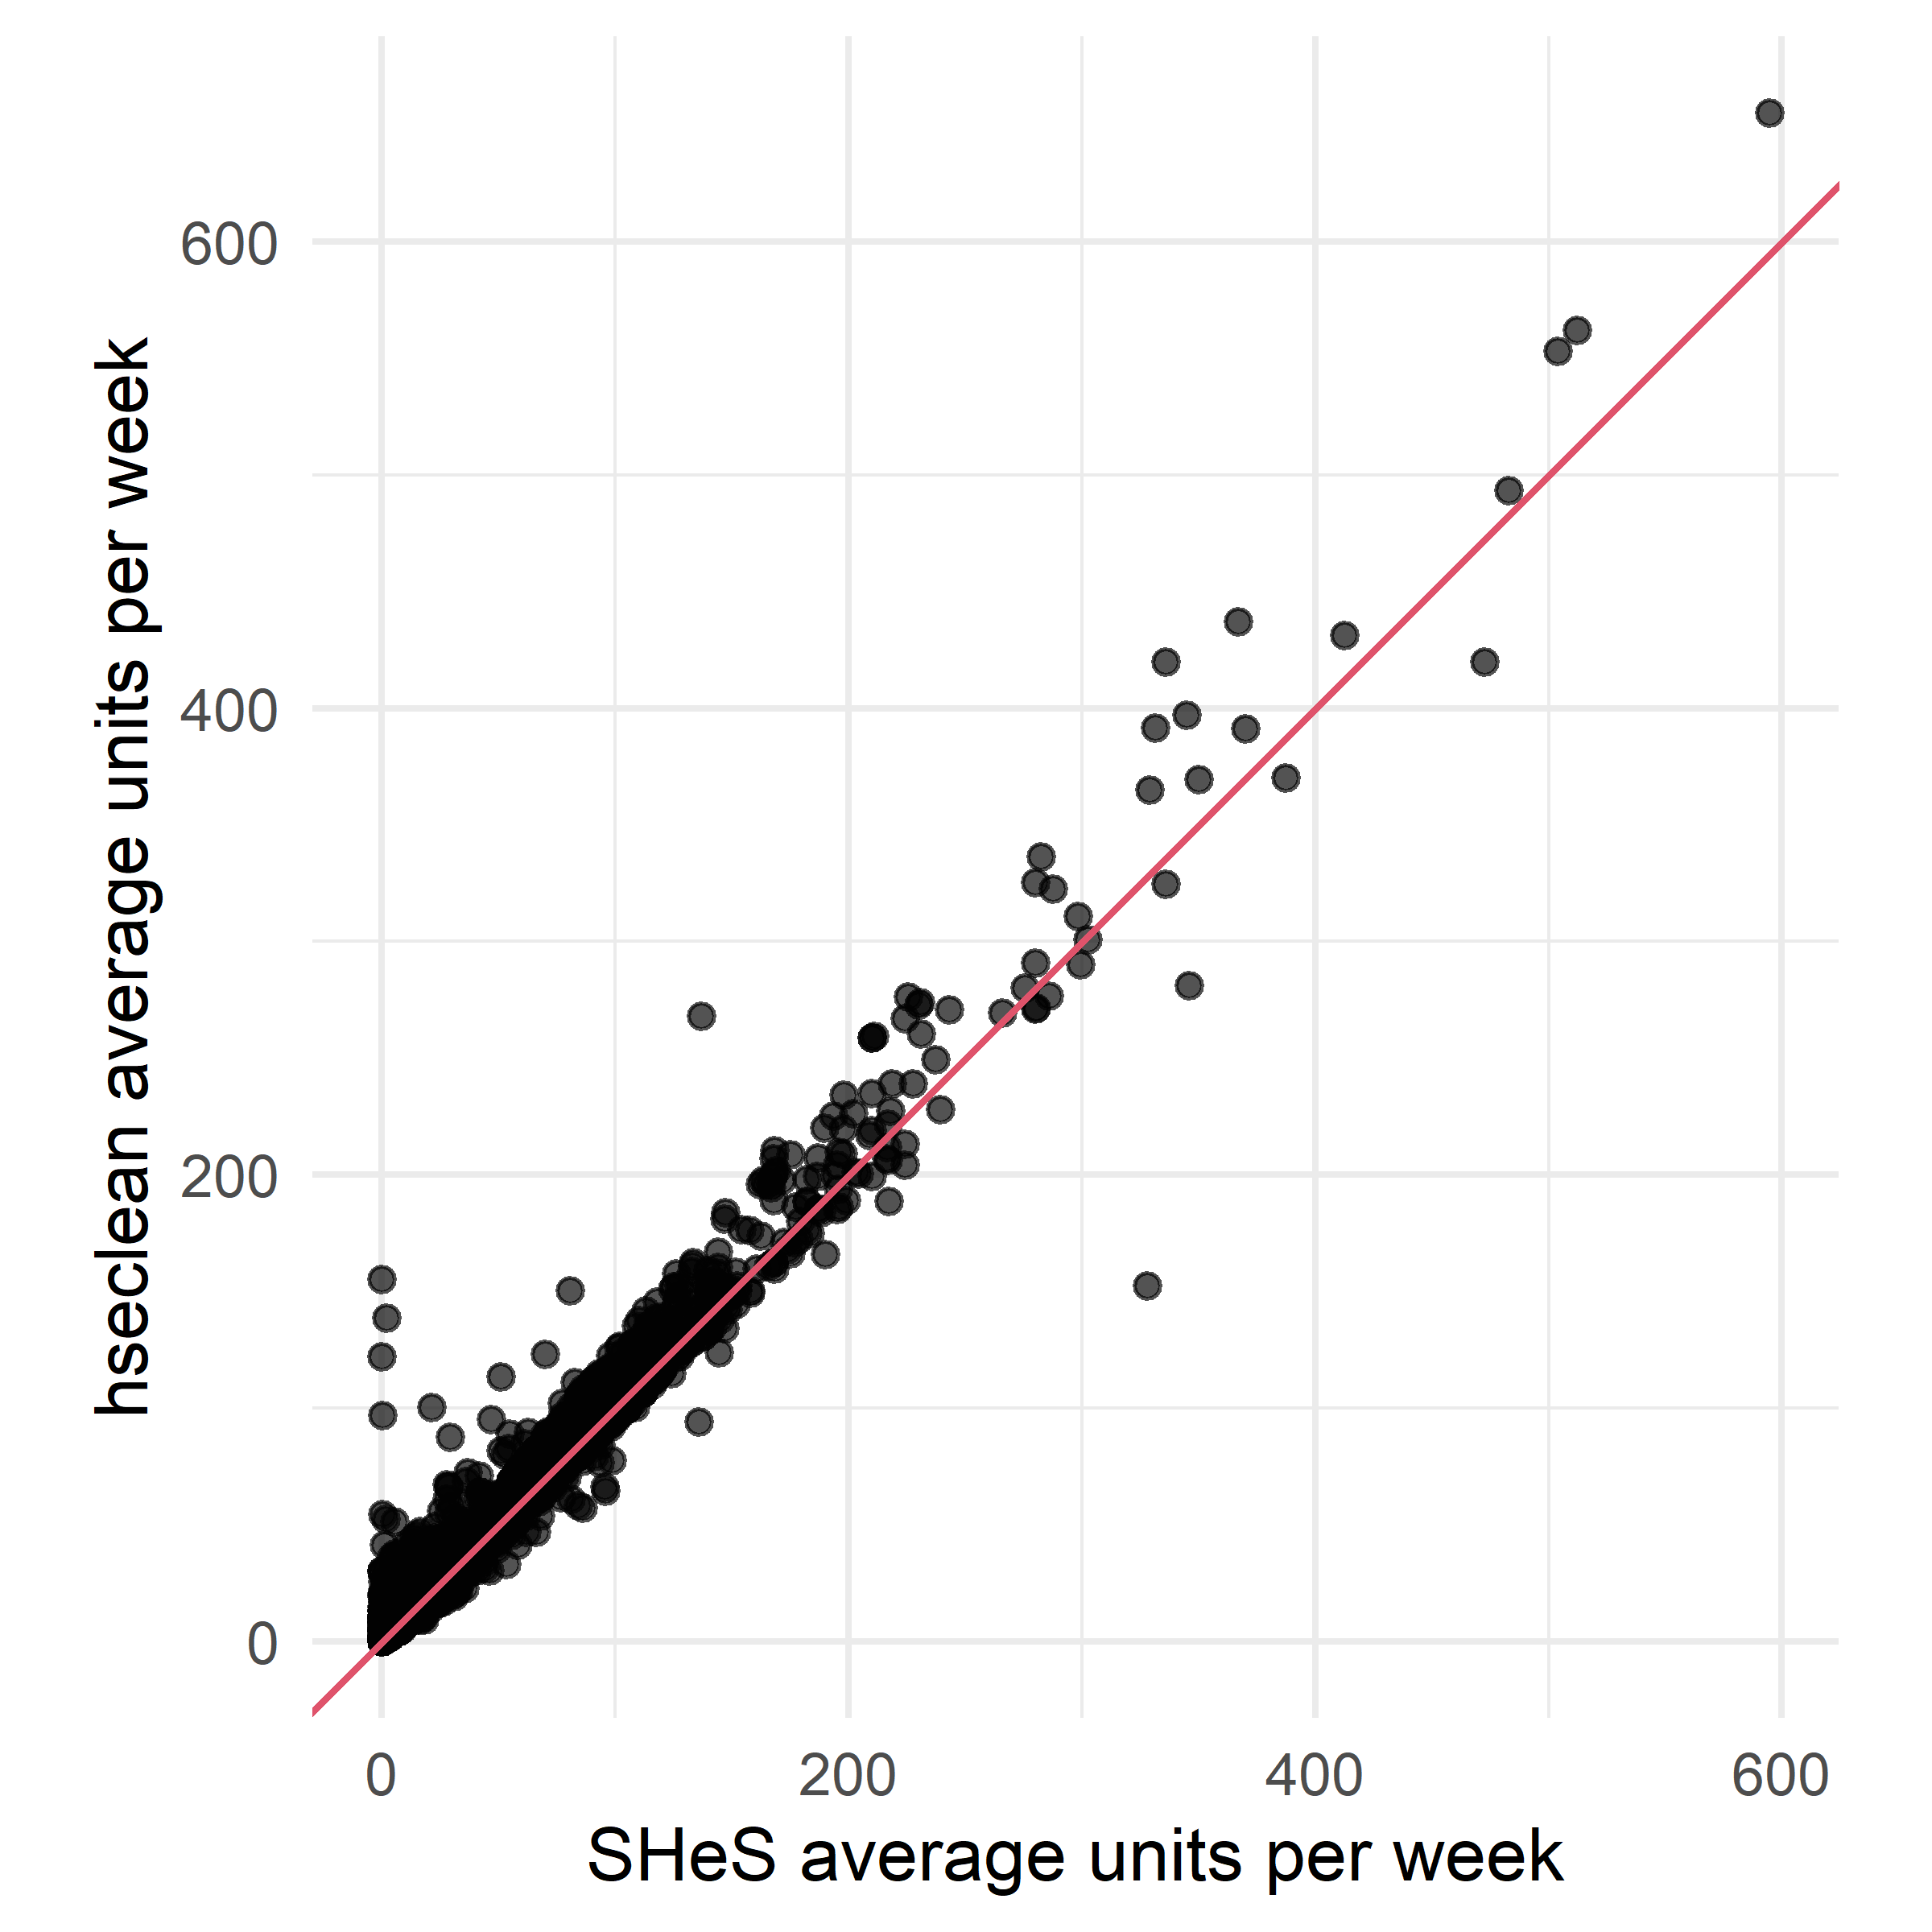
Figure 4. Average weekly alcohol consumption calculated from hseclean vs. that supplied with the SHeS data for the pooled sample of 2008 to 2019.
Calendar year trends in average weekly alcohol consumption
Proportion of people who drink alcohol
The plots below show trends in the proportion of people who drink alcohol between ages 16 and 89 years old. Someone is classed as drinking alcohol even if they drink alcohol only once or twice a year.
For the general population age 16 to 89 years old, the proportion of people who drink alcohol ranges from 0.87 in 2008 to 0.82 in 2019.
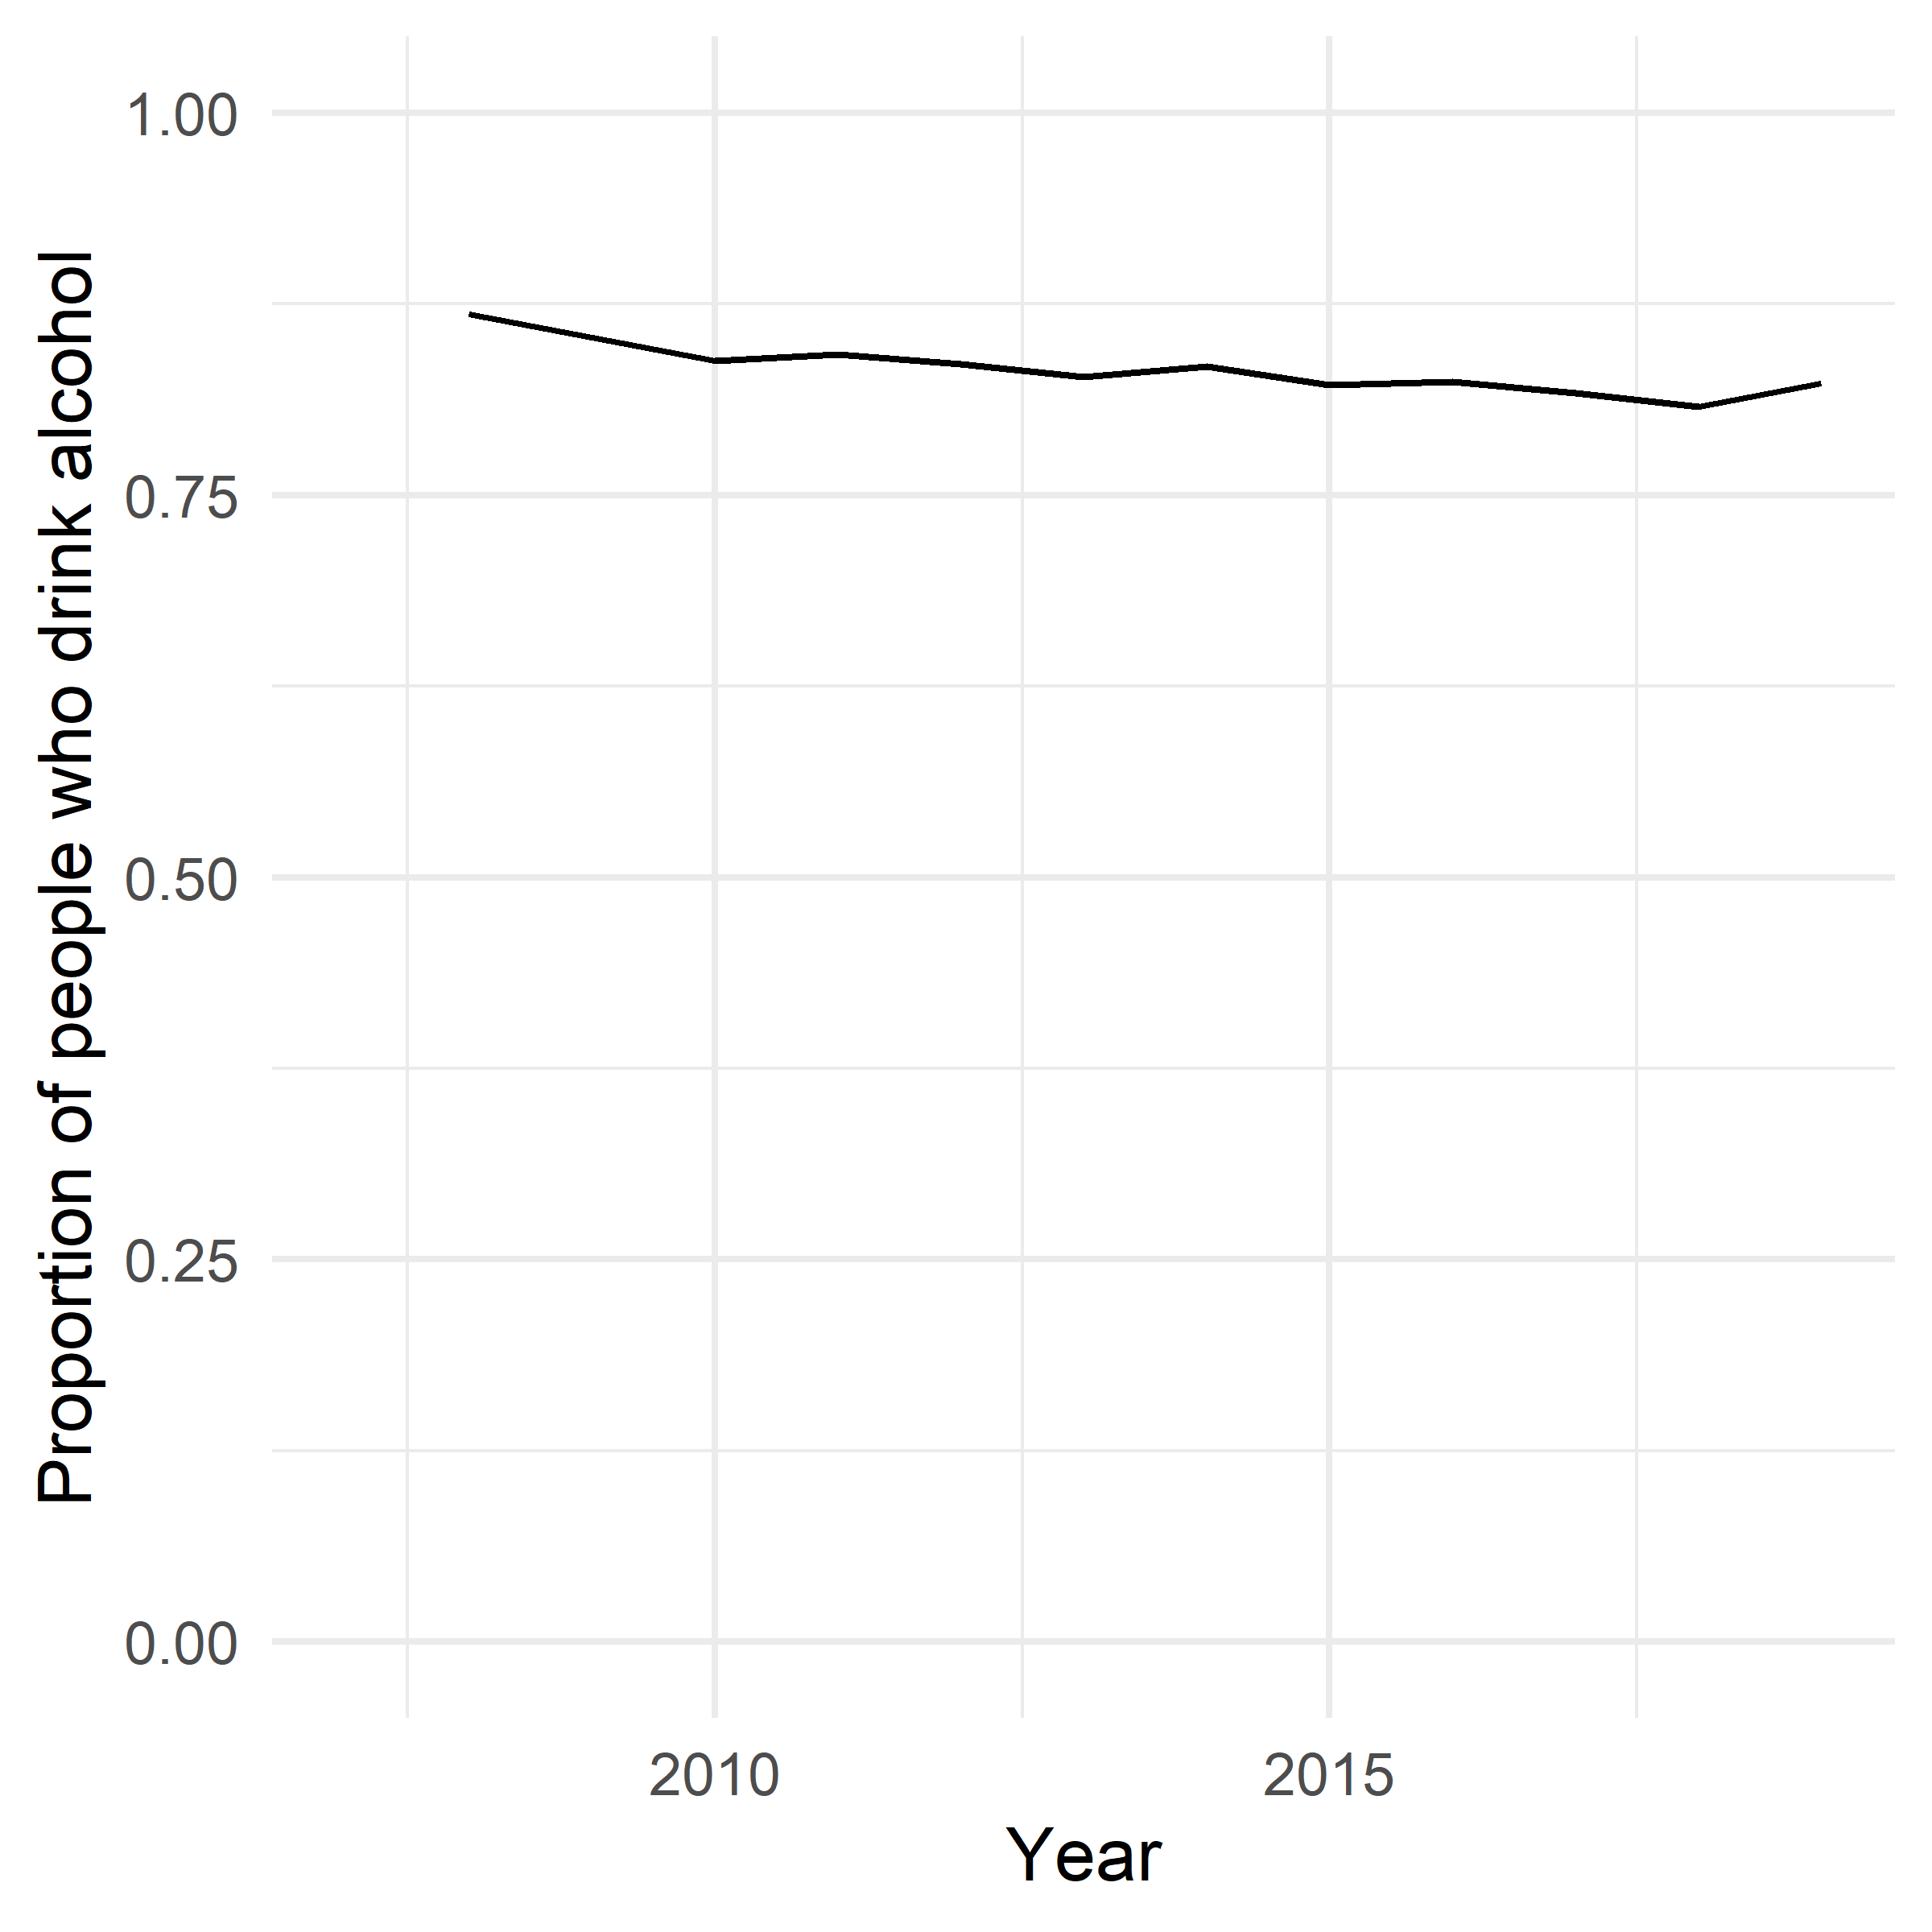
Figure 5. Proportion of people who drink alcohol.
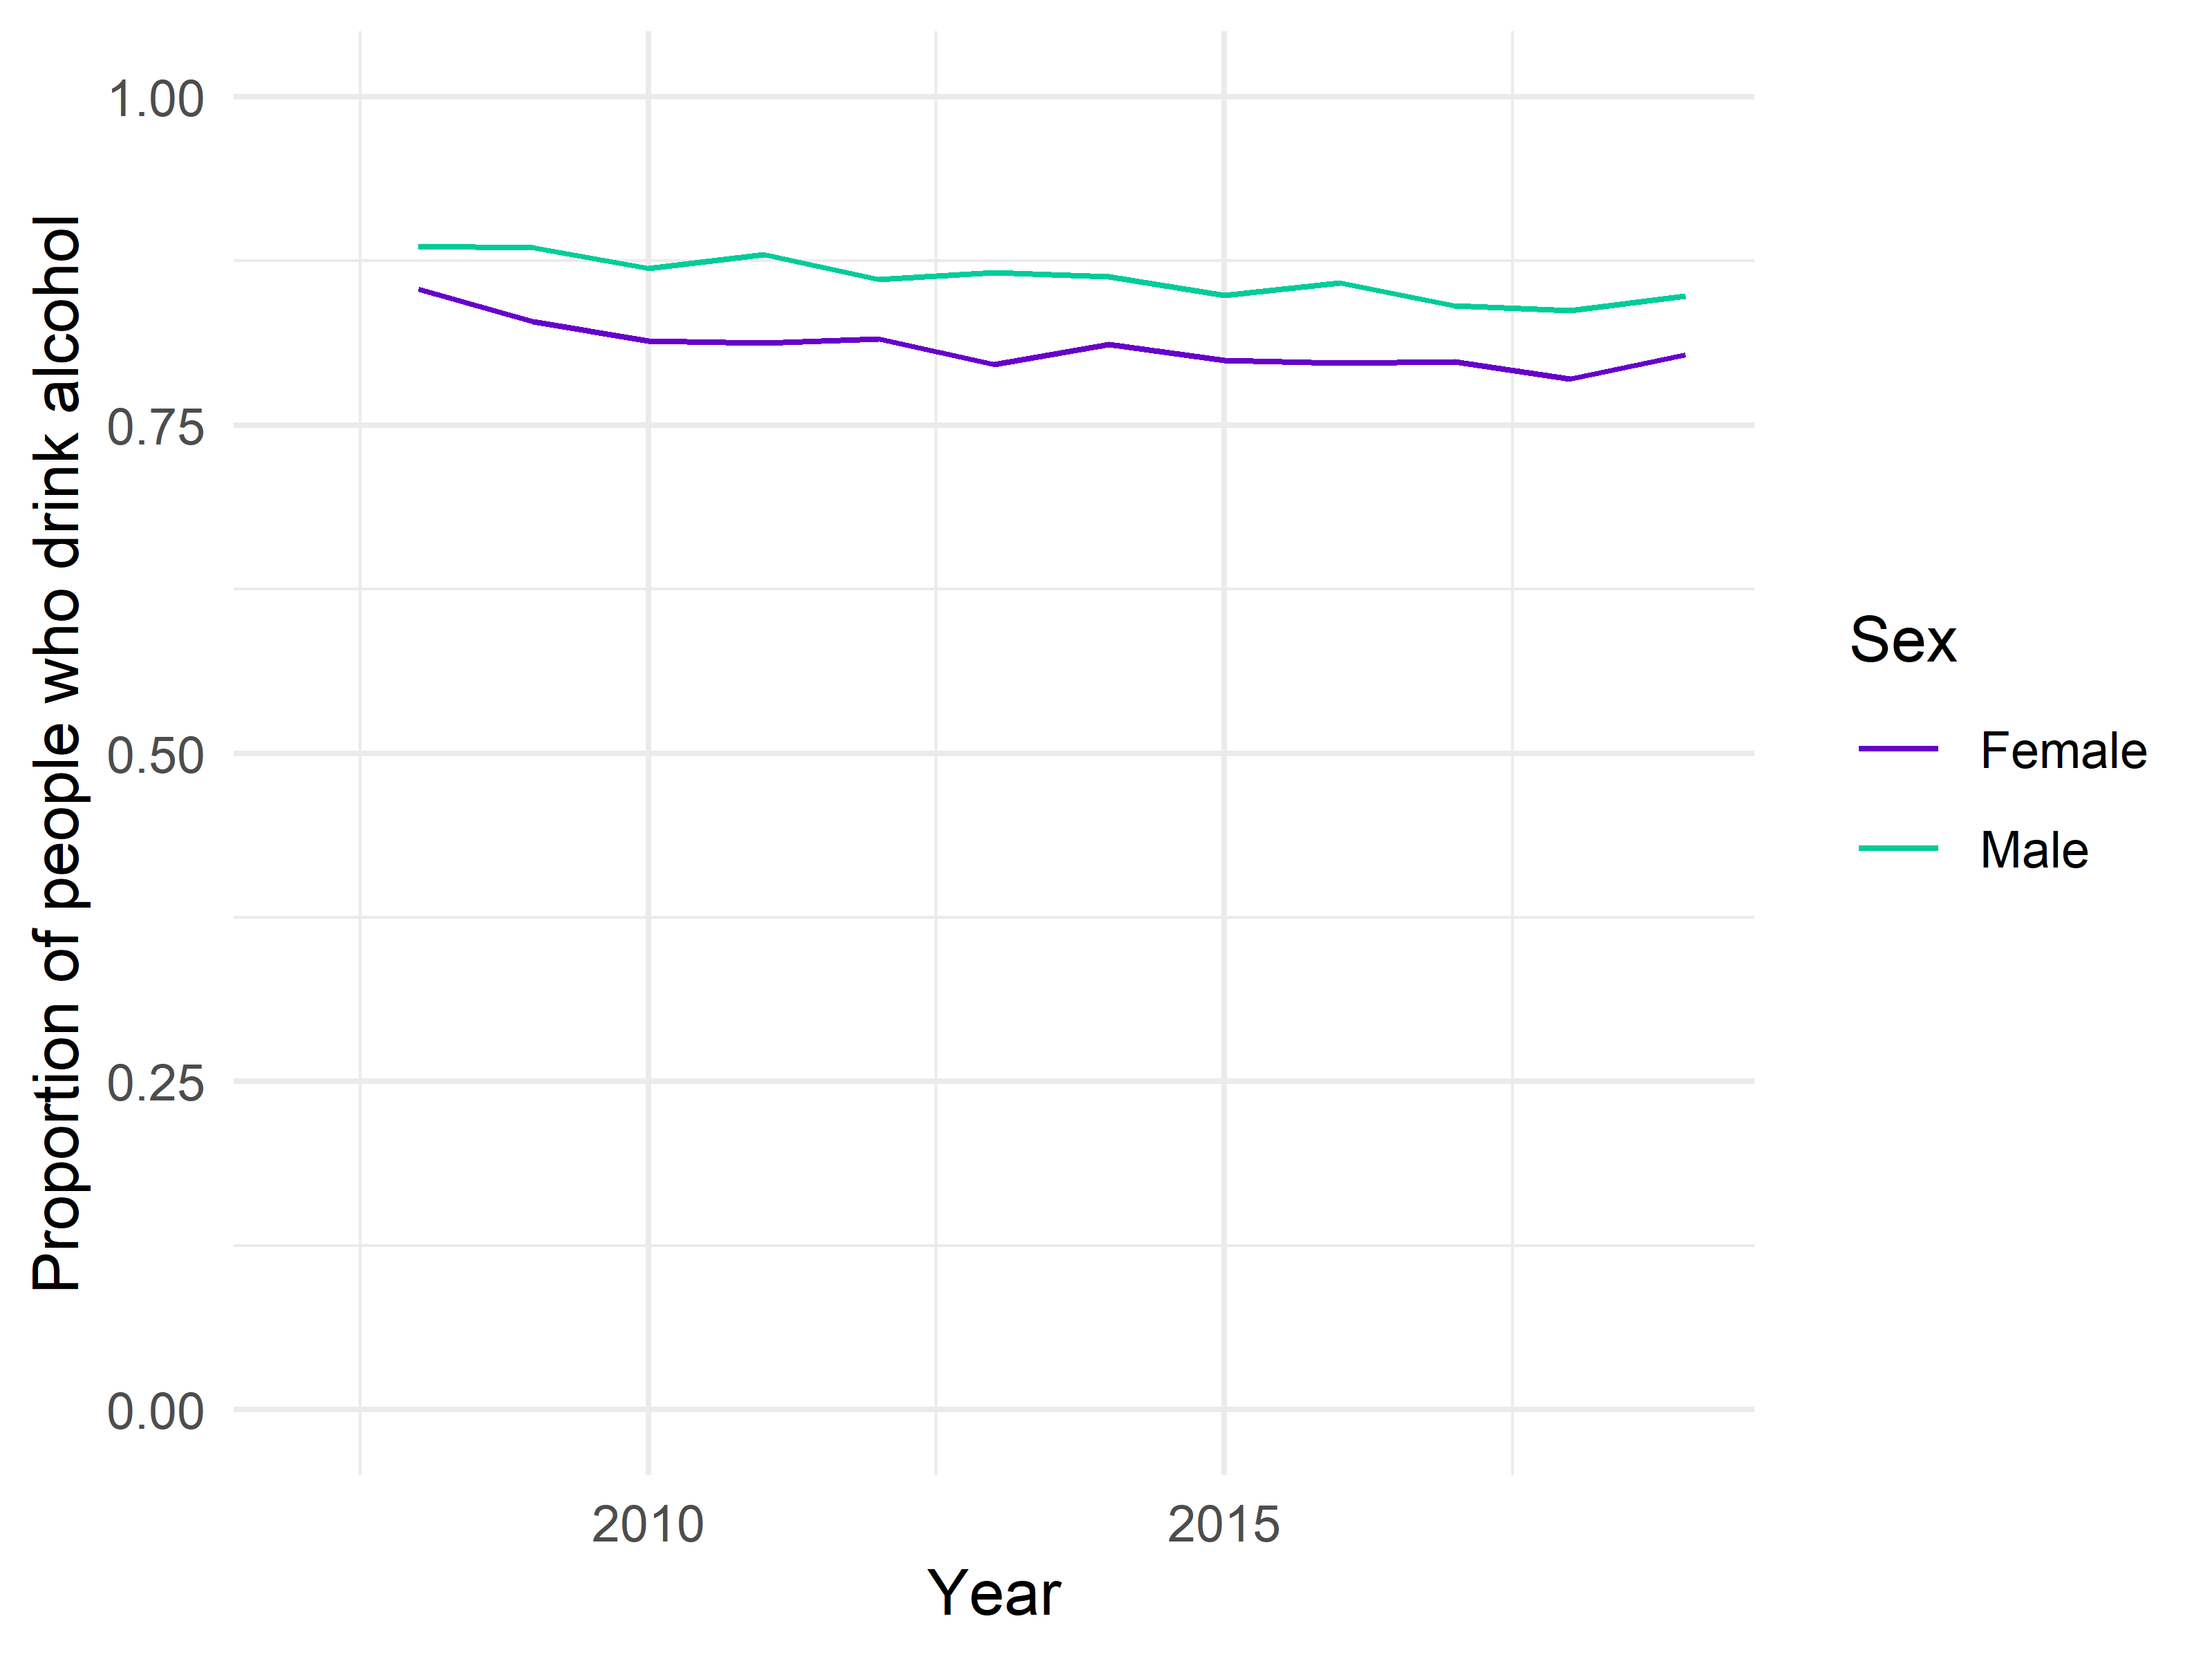
Figure 6. Sex specific proportion of people who drink alcohol.
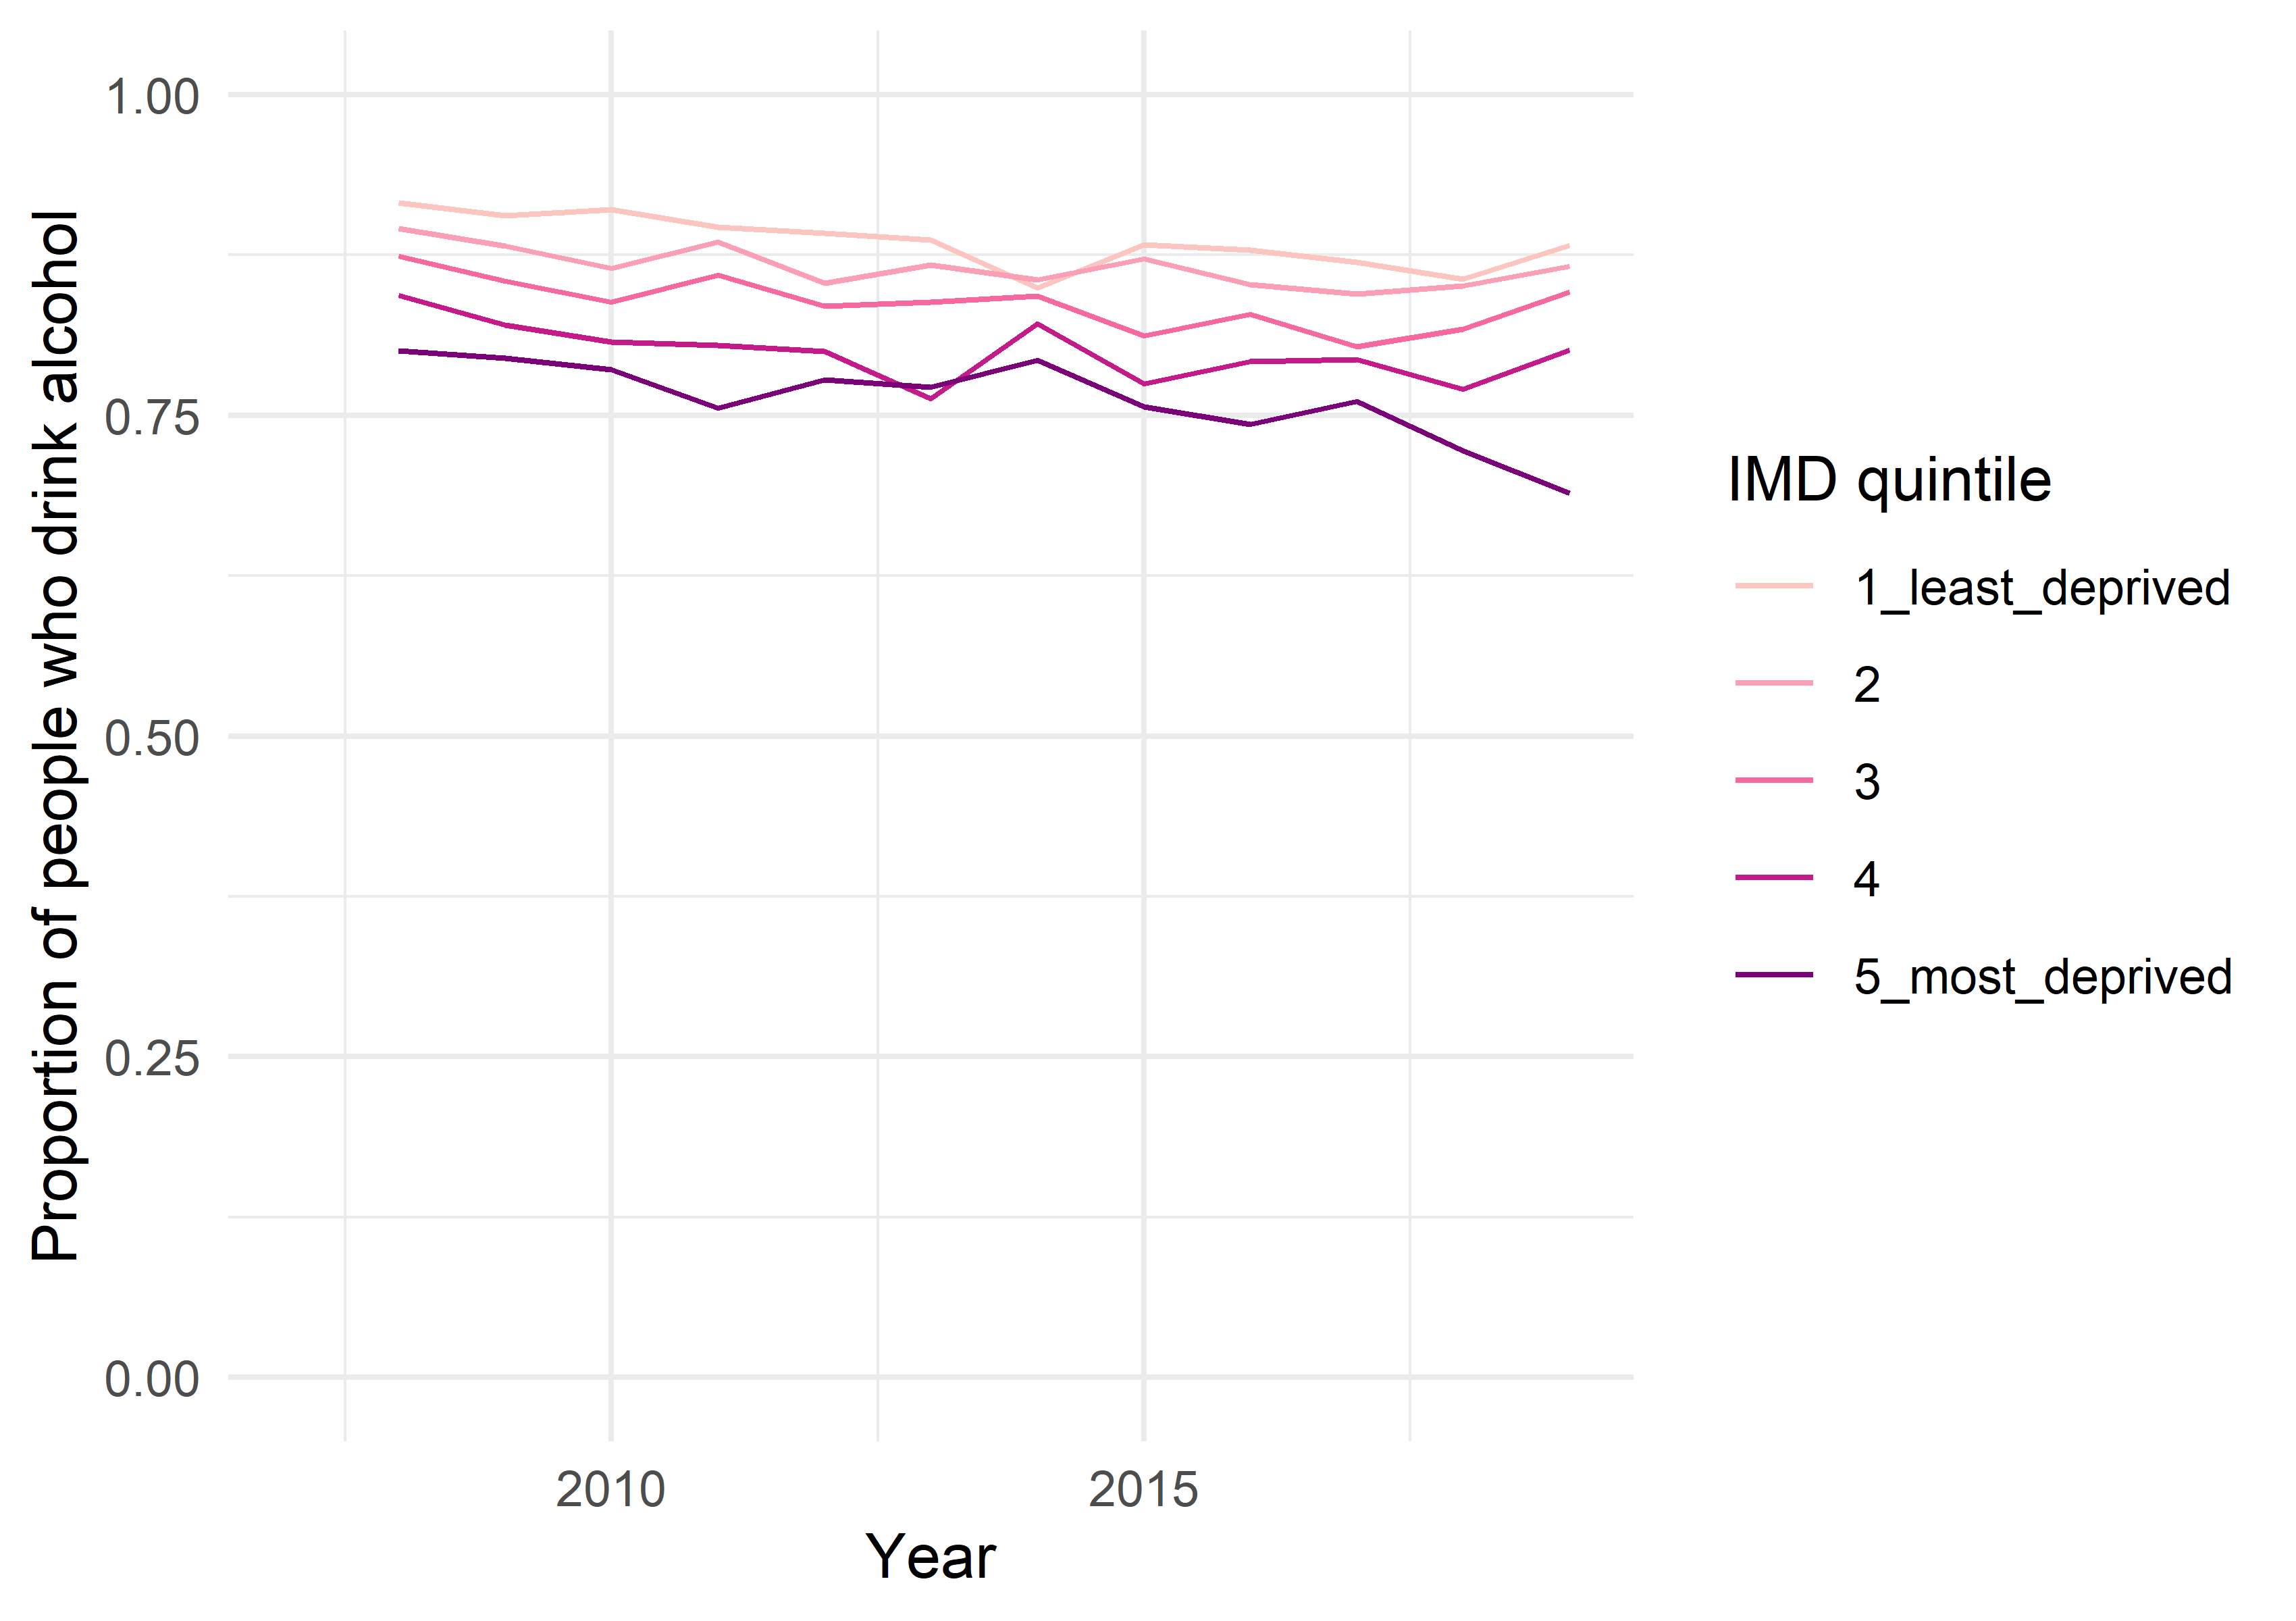
Figure 7. Index of Multiple Deprivation specific proportion of people who drink alcohol.
Average weekly alcohol consumption by people who consume some alcohol
The average weekly alcohol consumption by people who consume alcohol considers all alcohol consumed by people who drink who drink as little as once or twice a year to people who drink every day. No upper limit is applied to the amount of alcohol consumed.
For the general population age 16 to 89 years old, the average UK standard units of ethanol consumed per week by drinkers ranges from 12.57 units in 2008 to 10.25 units in 2019.
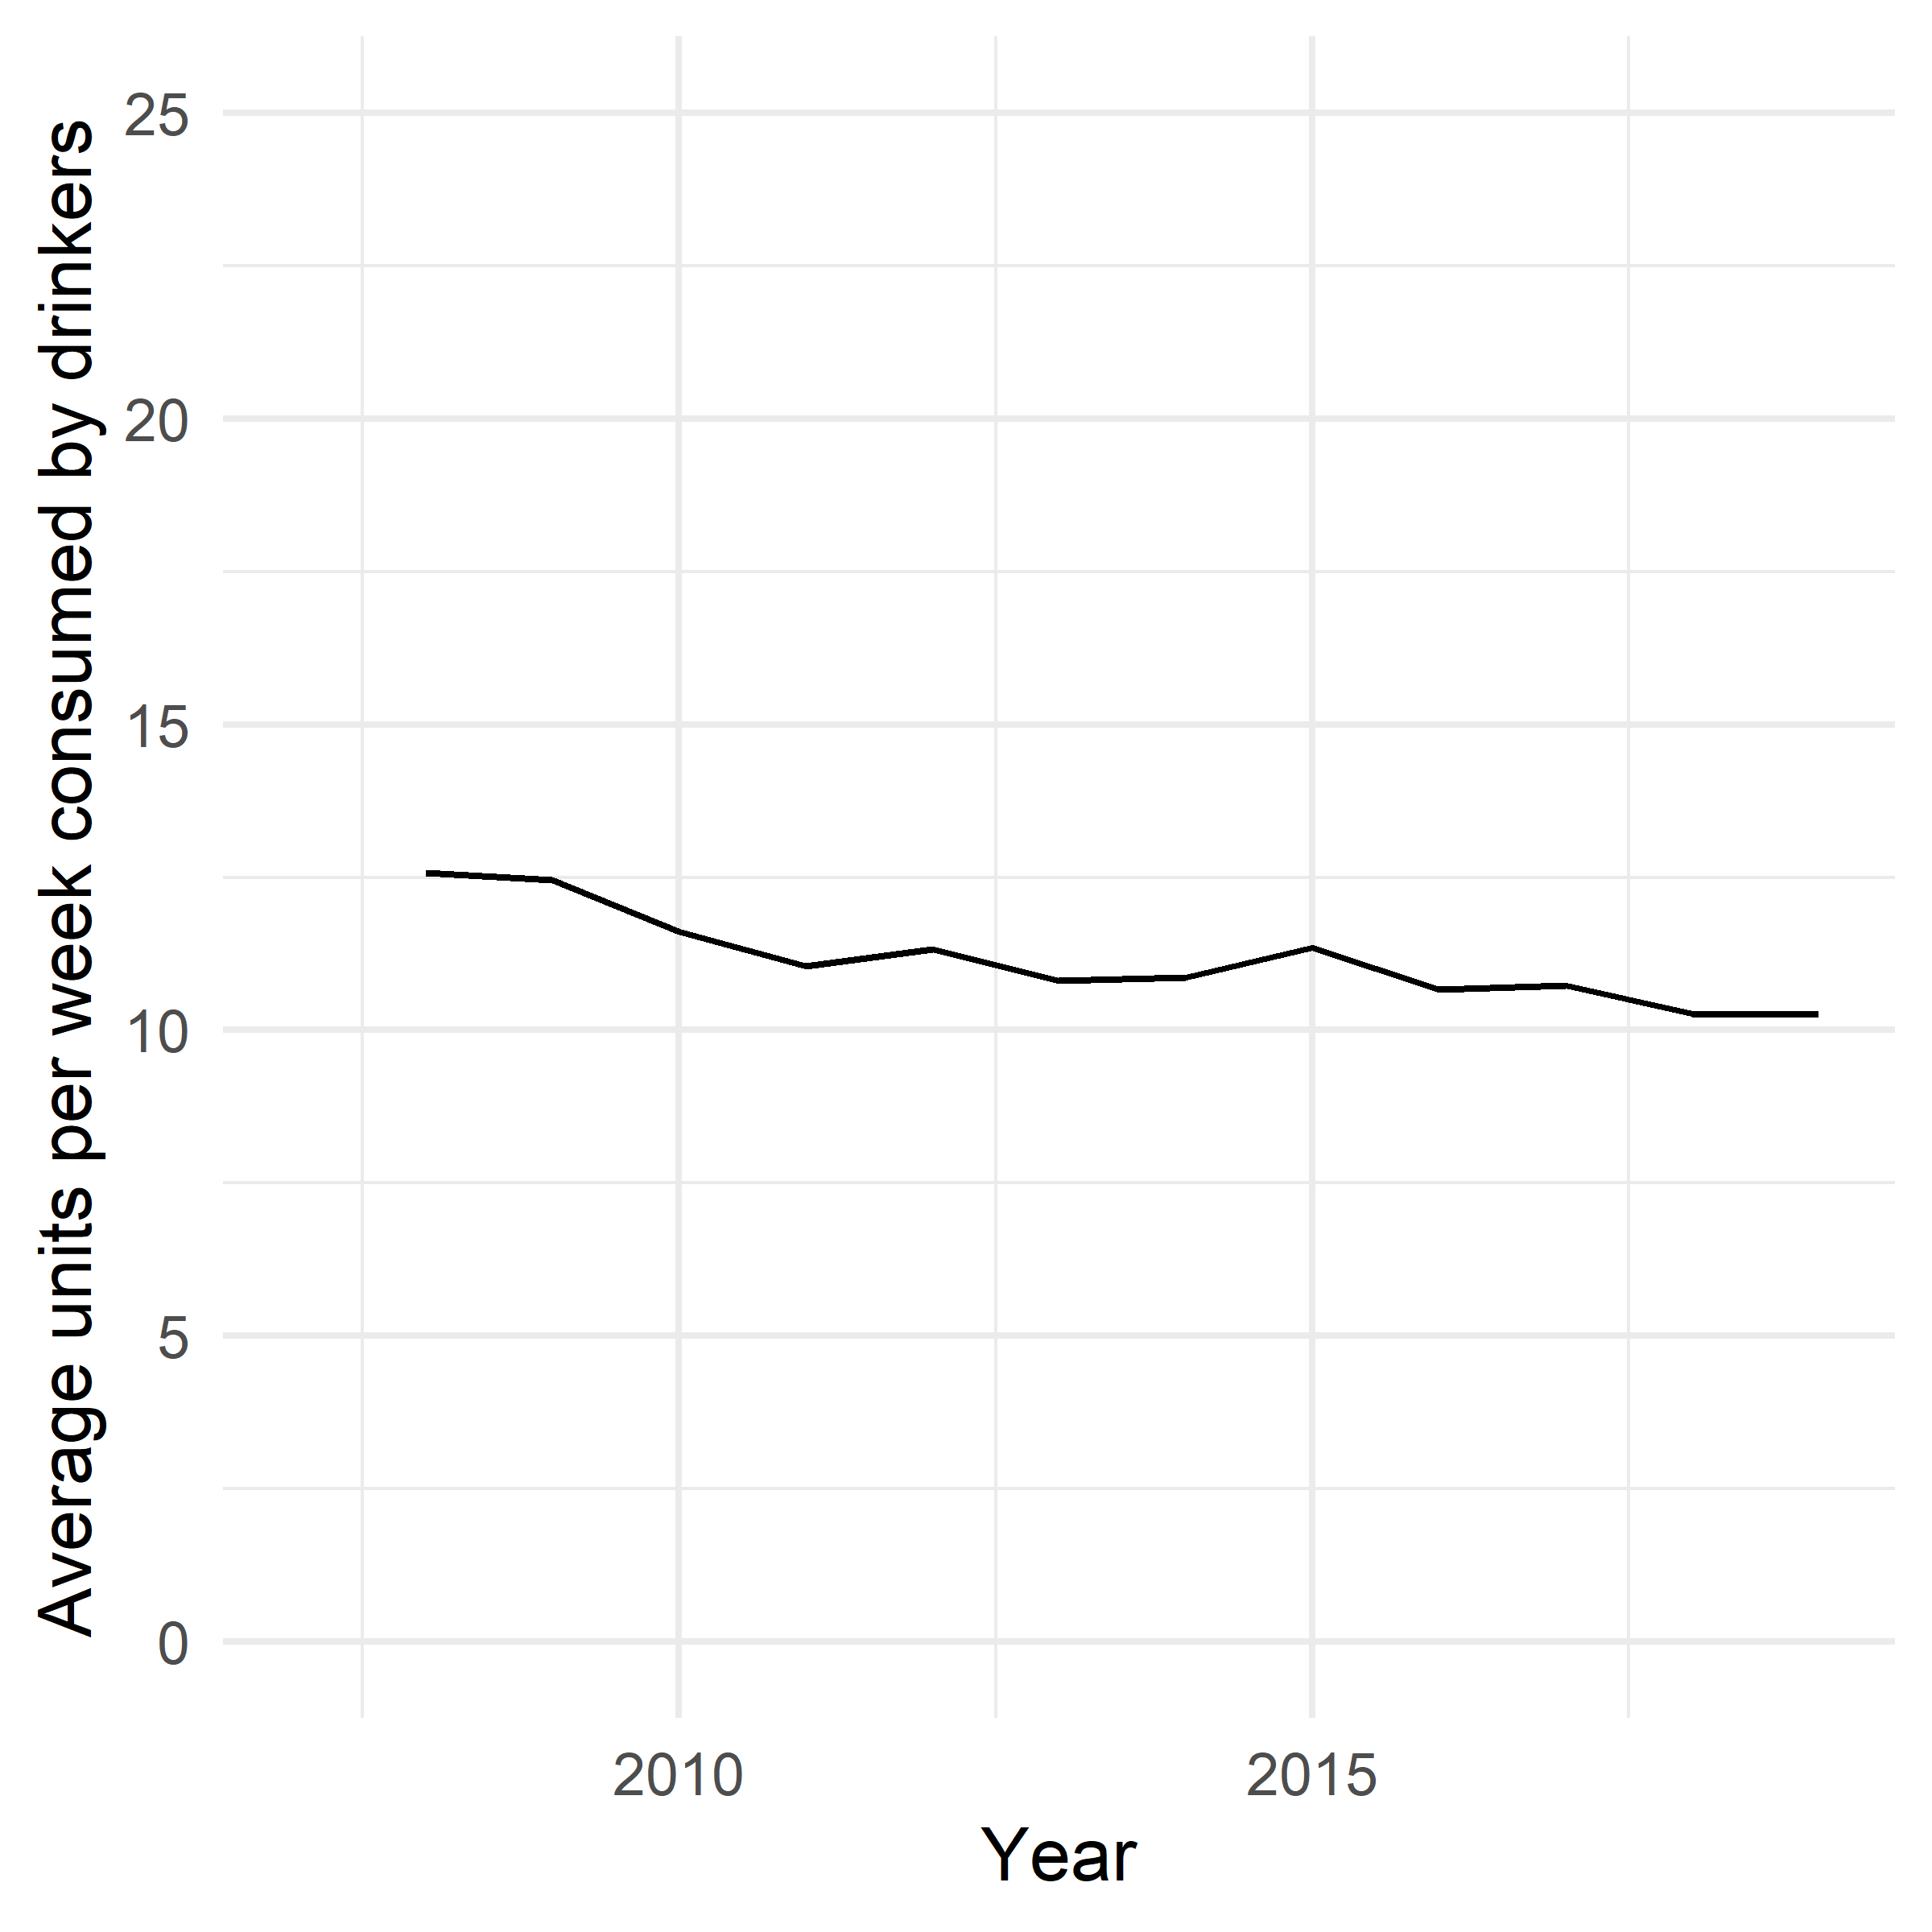
Figure 8. Average amount drunk per week by people who drink alcohol.
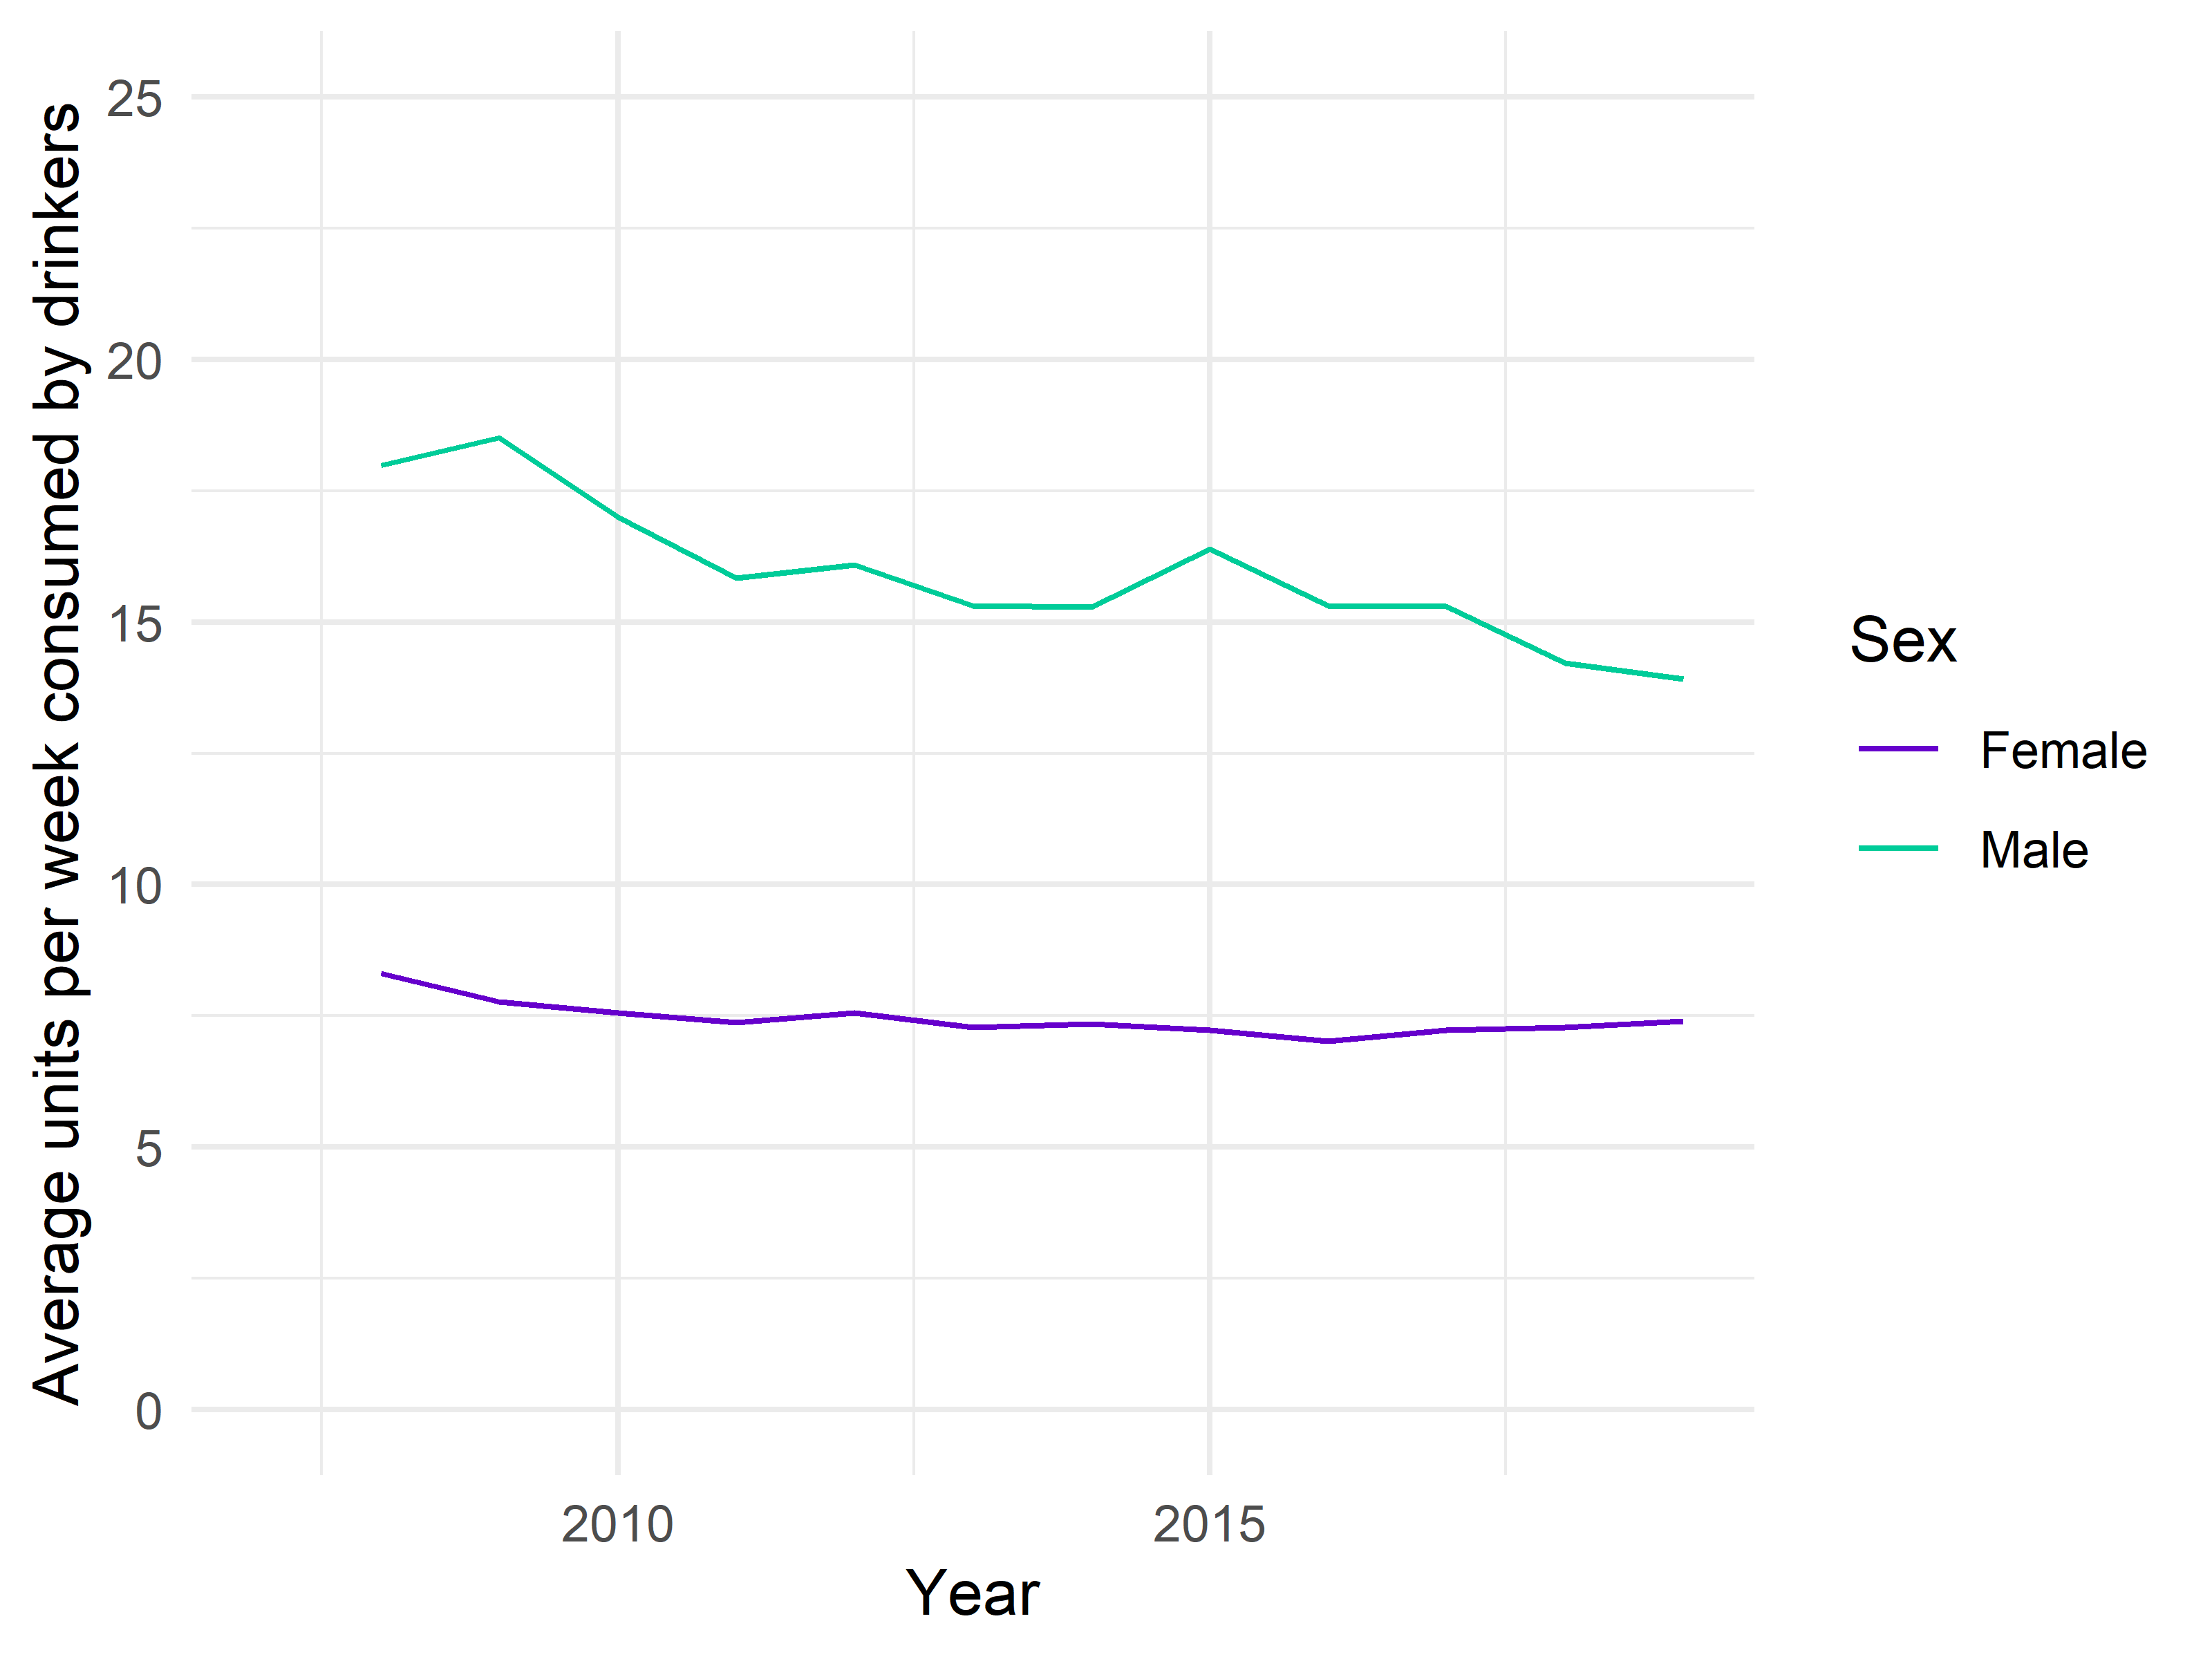
Figure 9. Sex specific average amount drunk per week by people who drink alcohol.
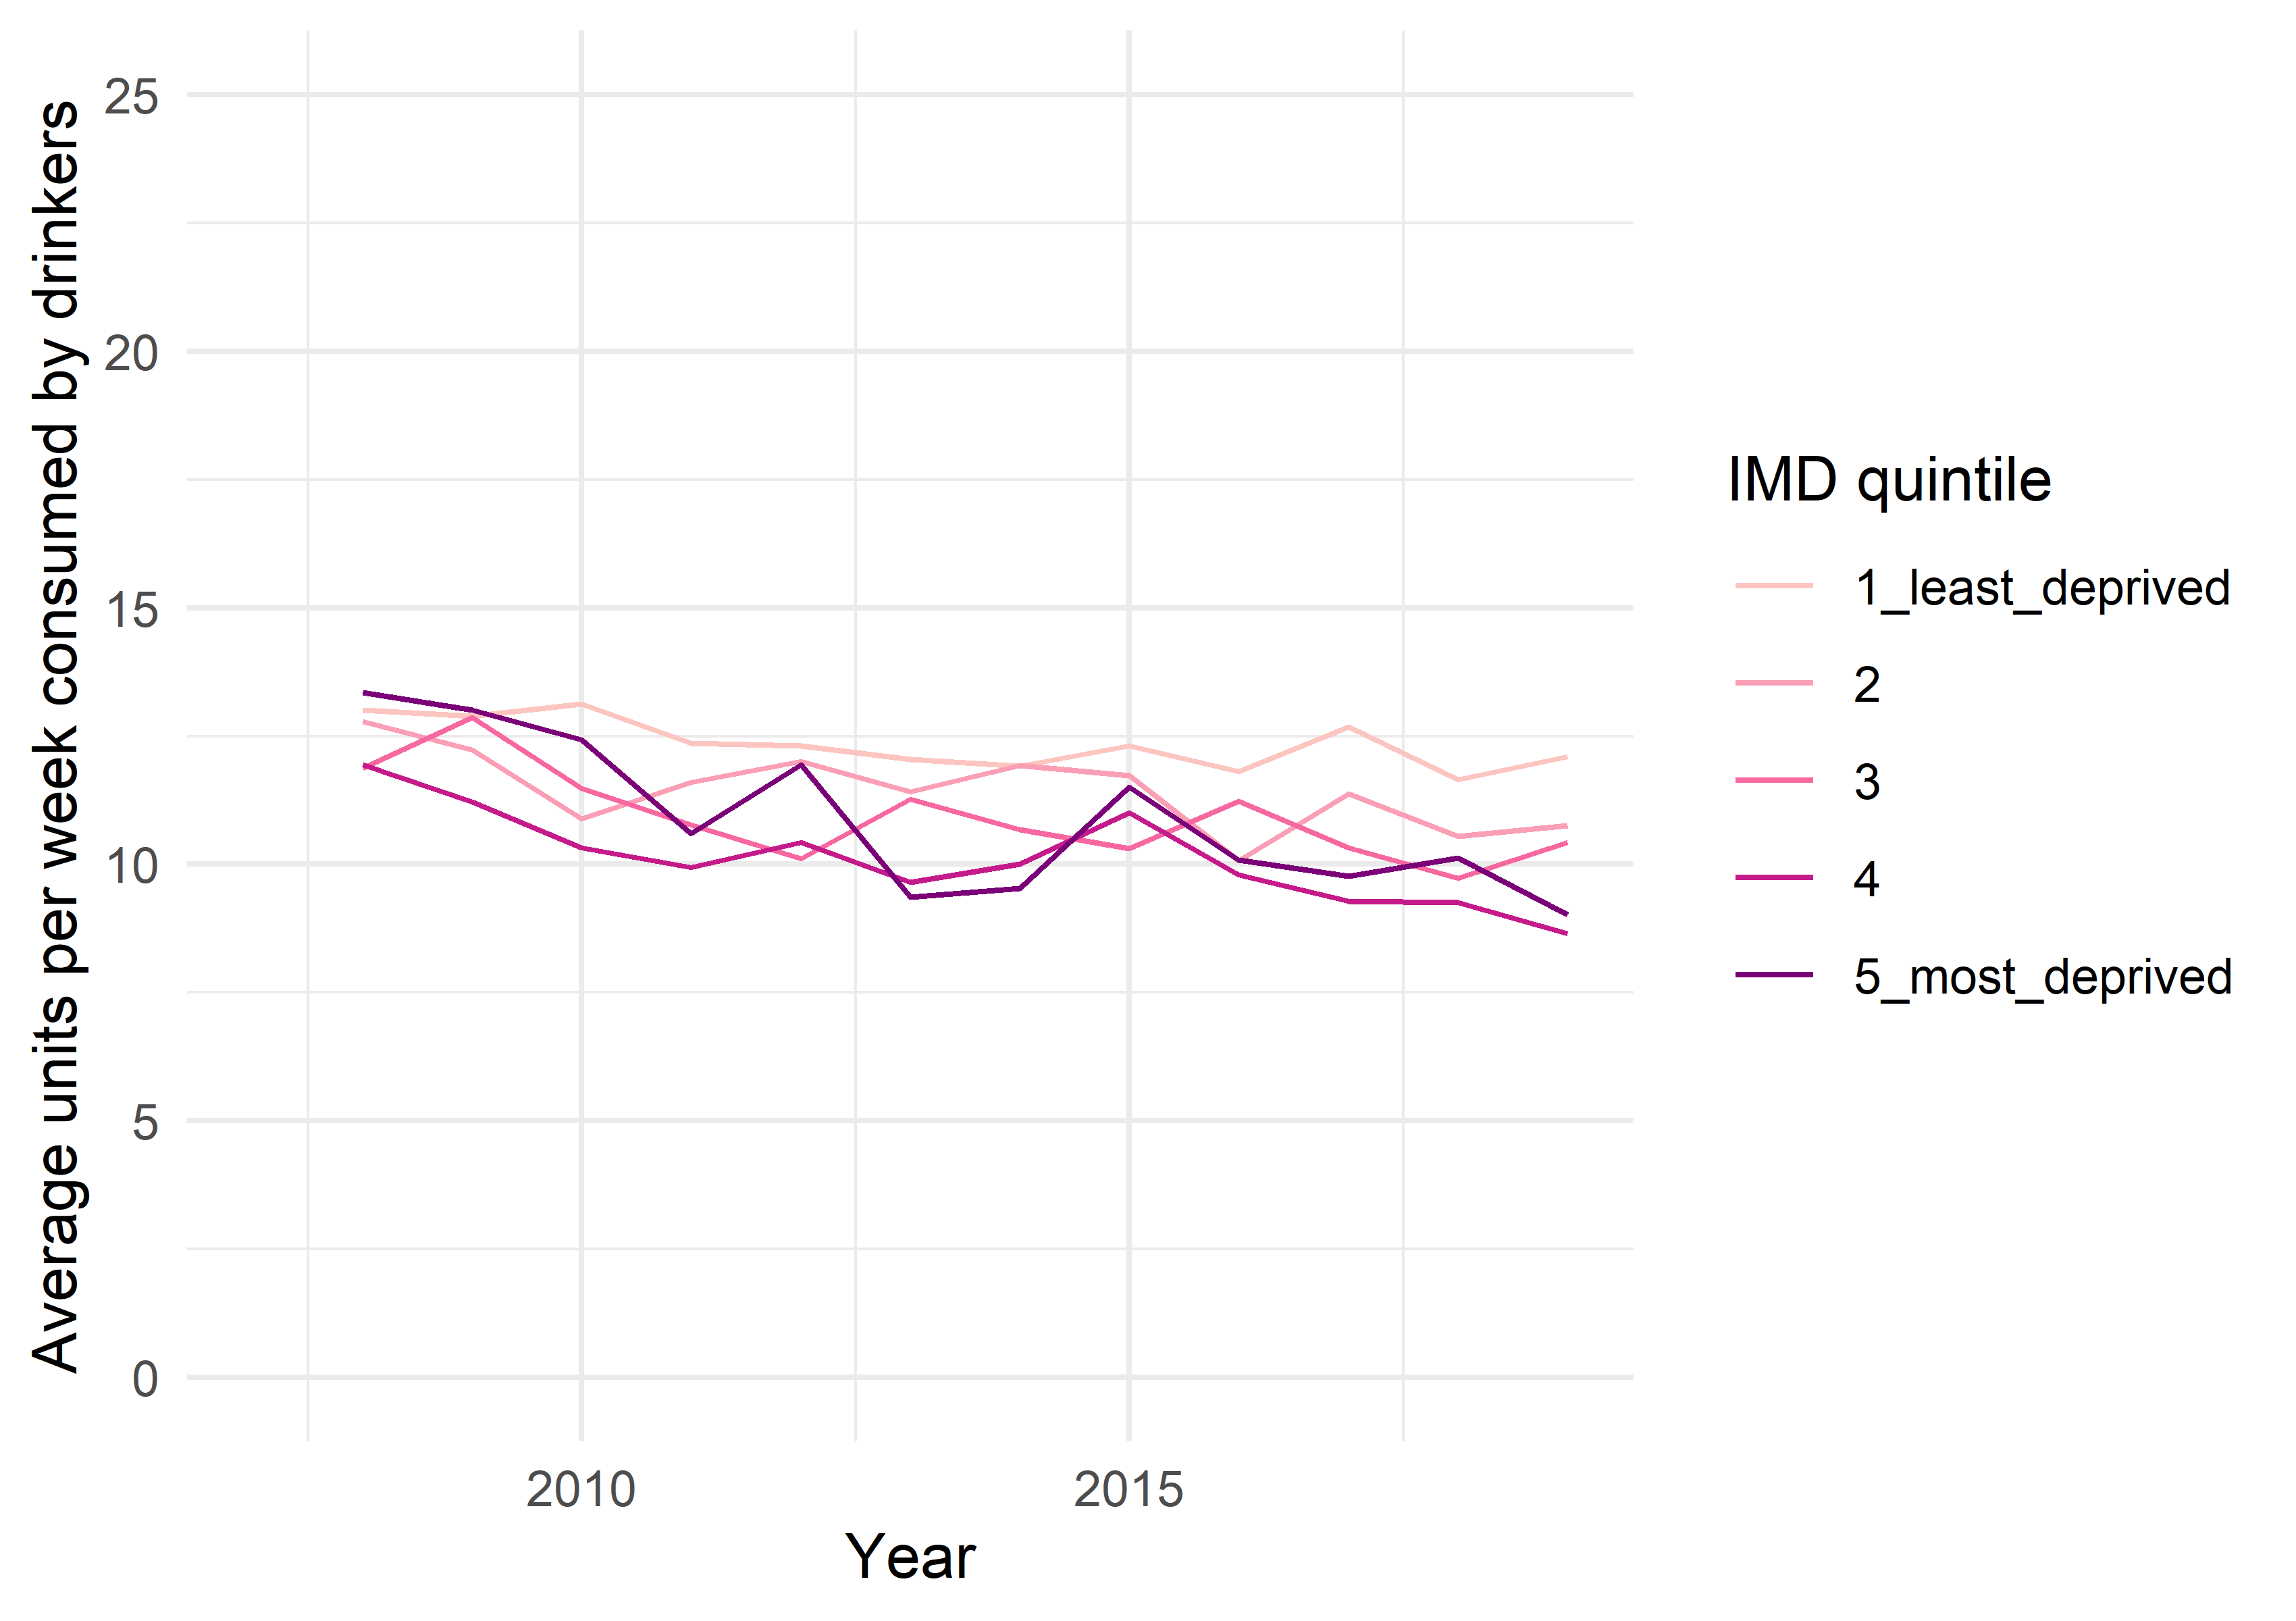
Figure 10. Index of Multiple Deprivation specific average amount drunk per week by people who drink alcohol.
Age trends in average weekly alcohol consumption
Proportion of people who drink alcohol
The proportion of people aged 16 to 89 years who drink alcohol at least once or twice a year peaks at 0.92 at age 19 and falls to 0.61 at age 89.
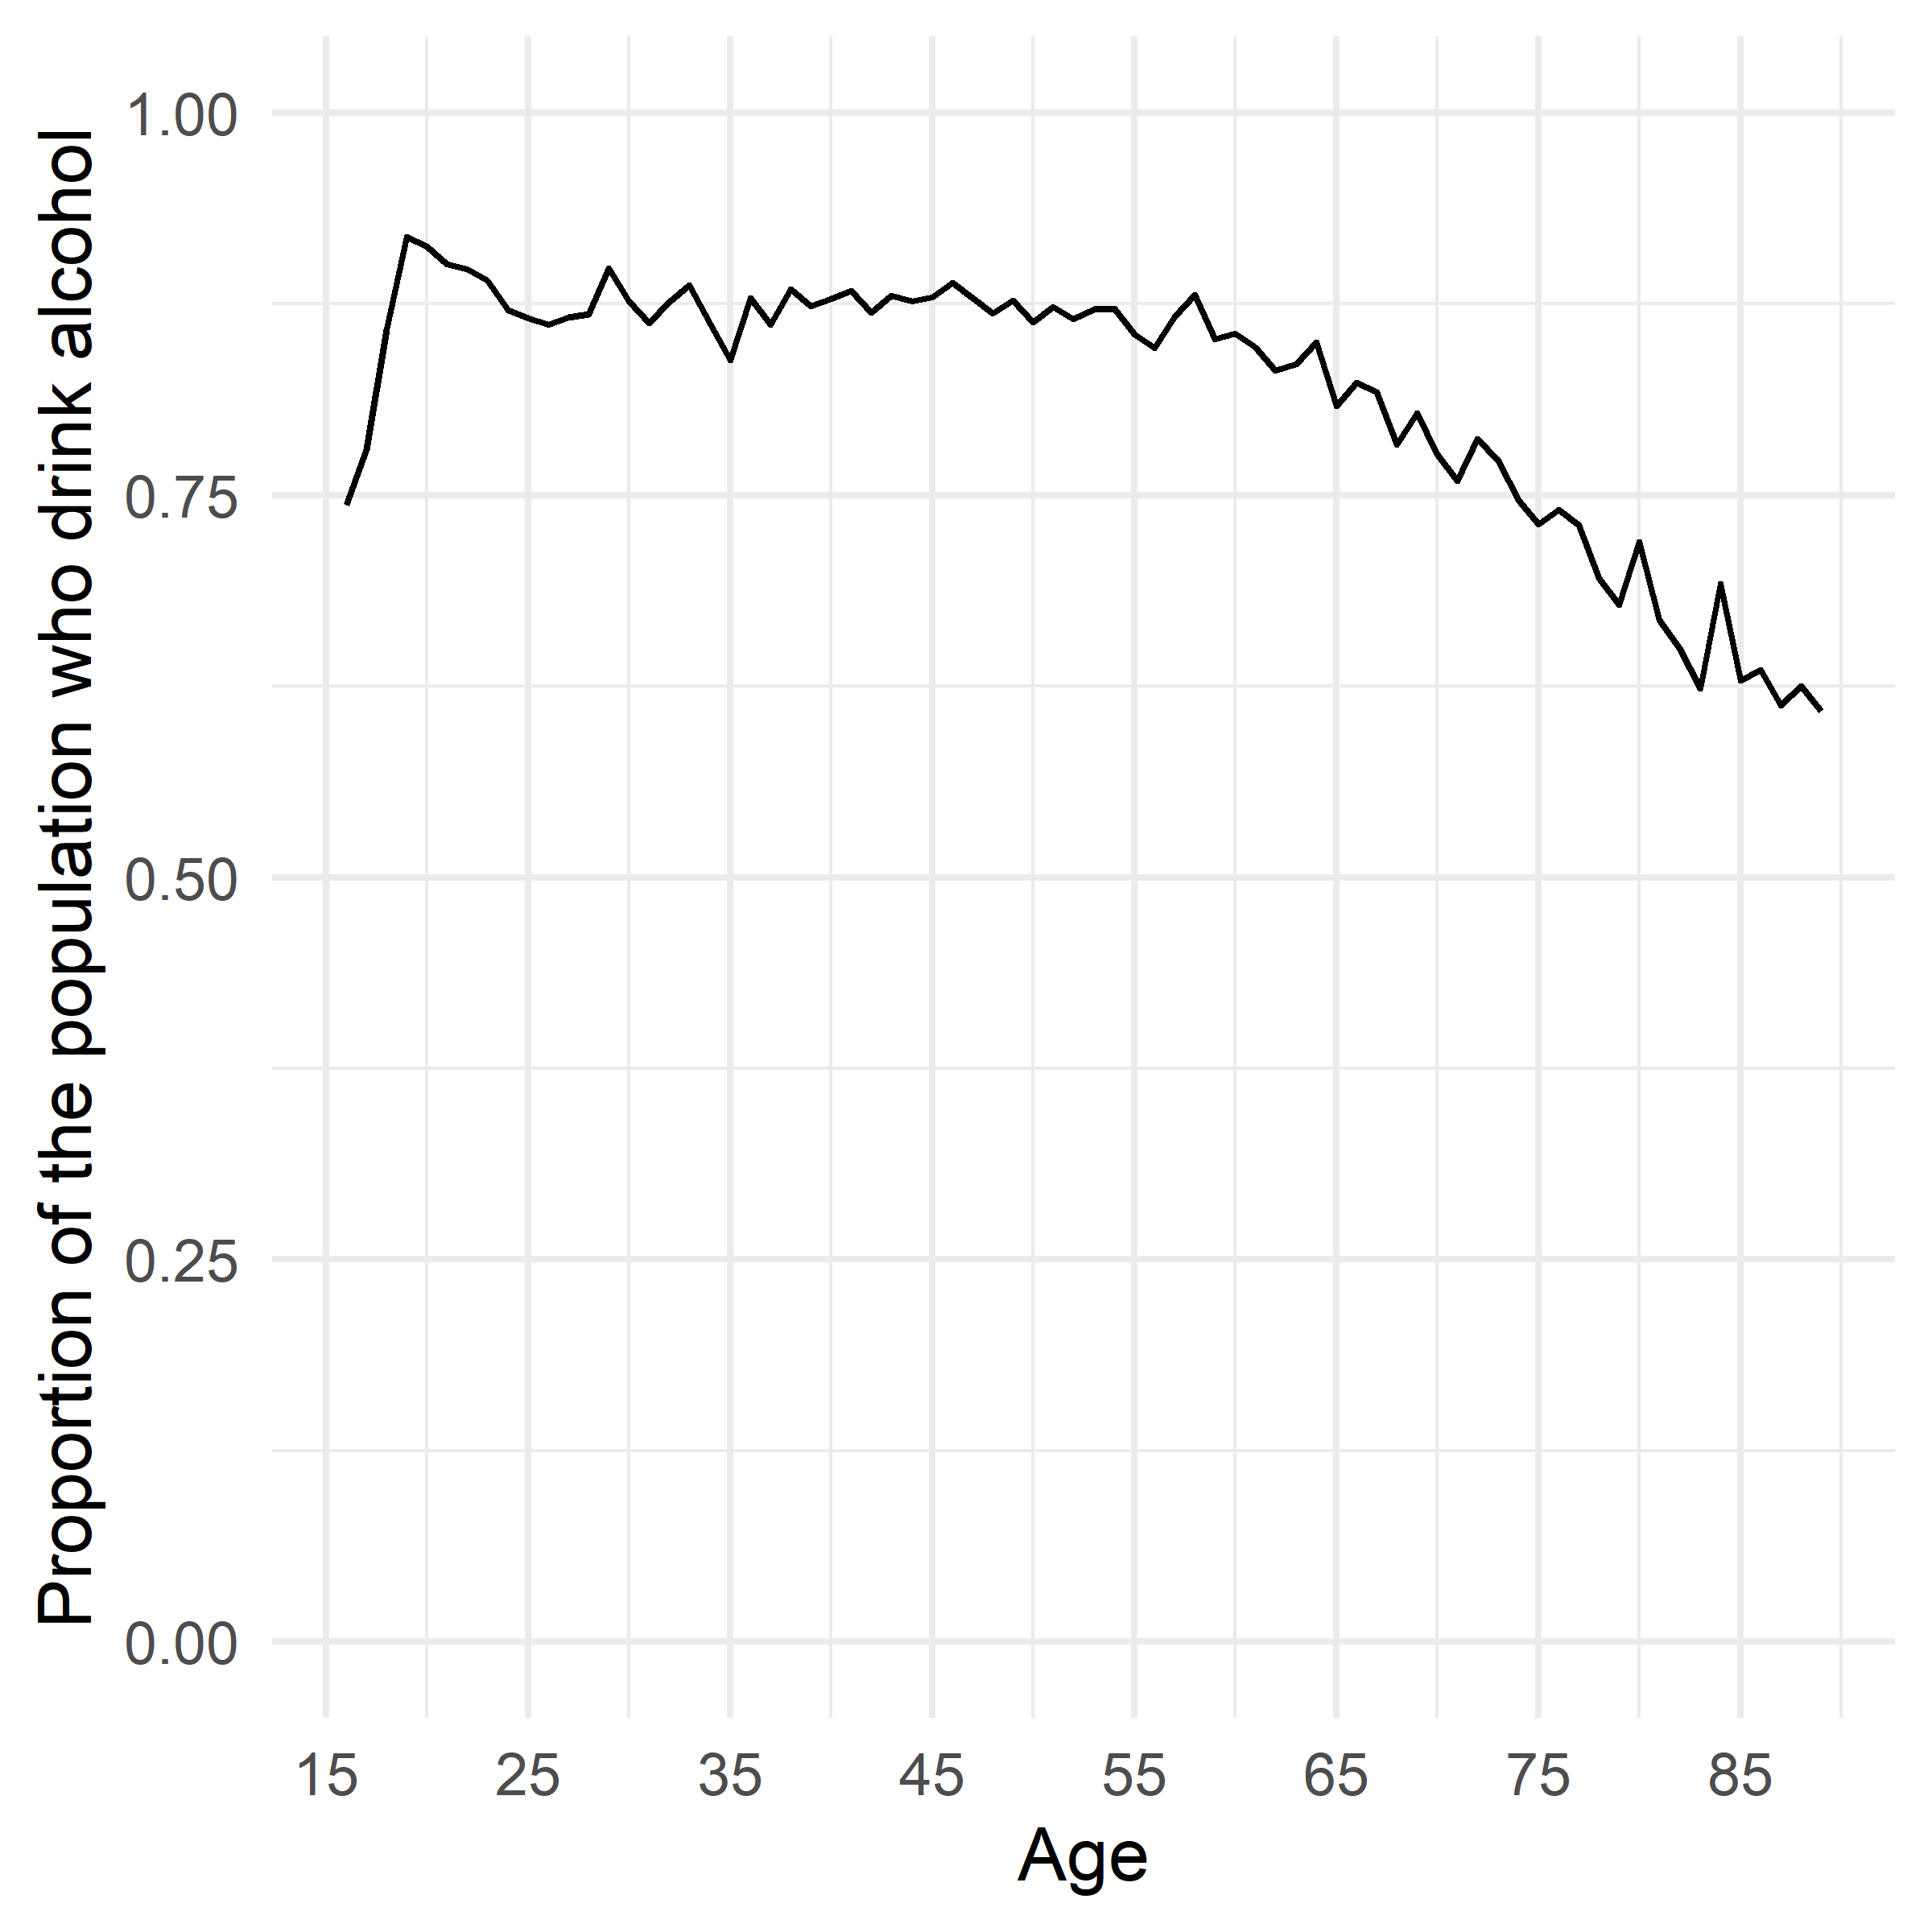
Figure 11. Age trends in the proportion of people who drink alcohol.
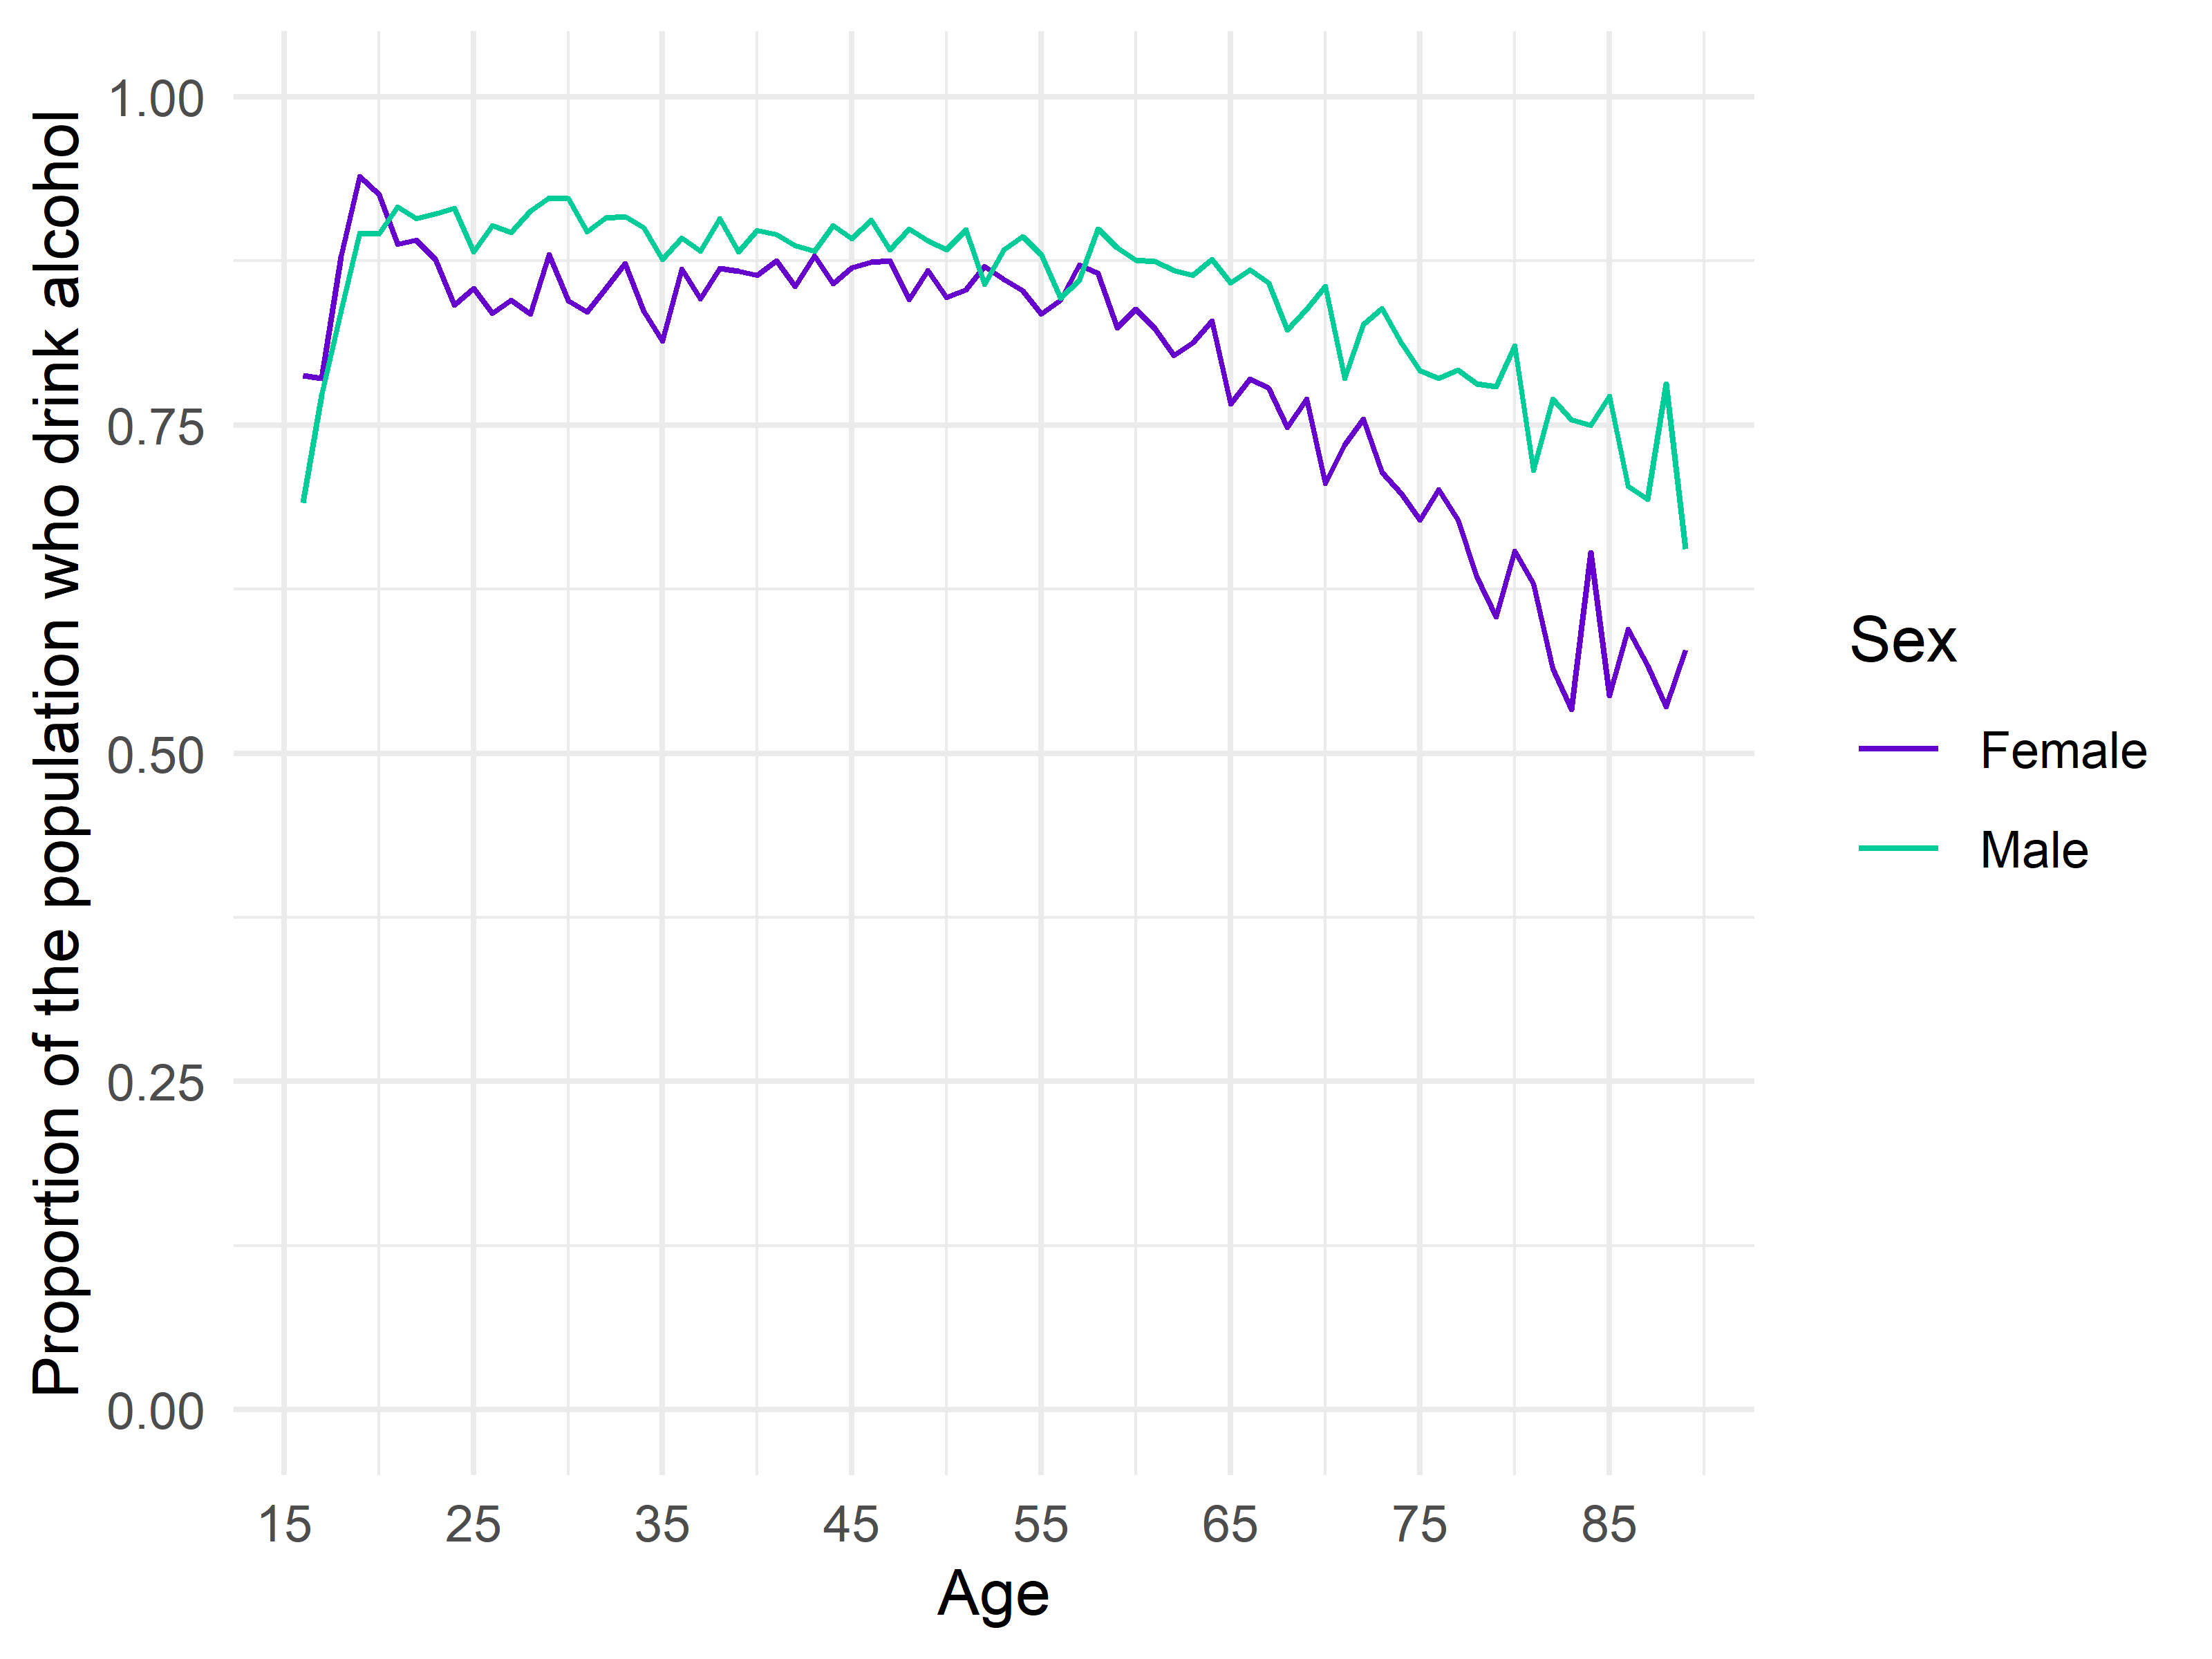
Figure 12. Sex specific age trends in the proportion of people who drink alcohol.
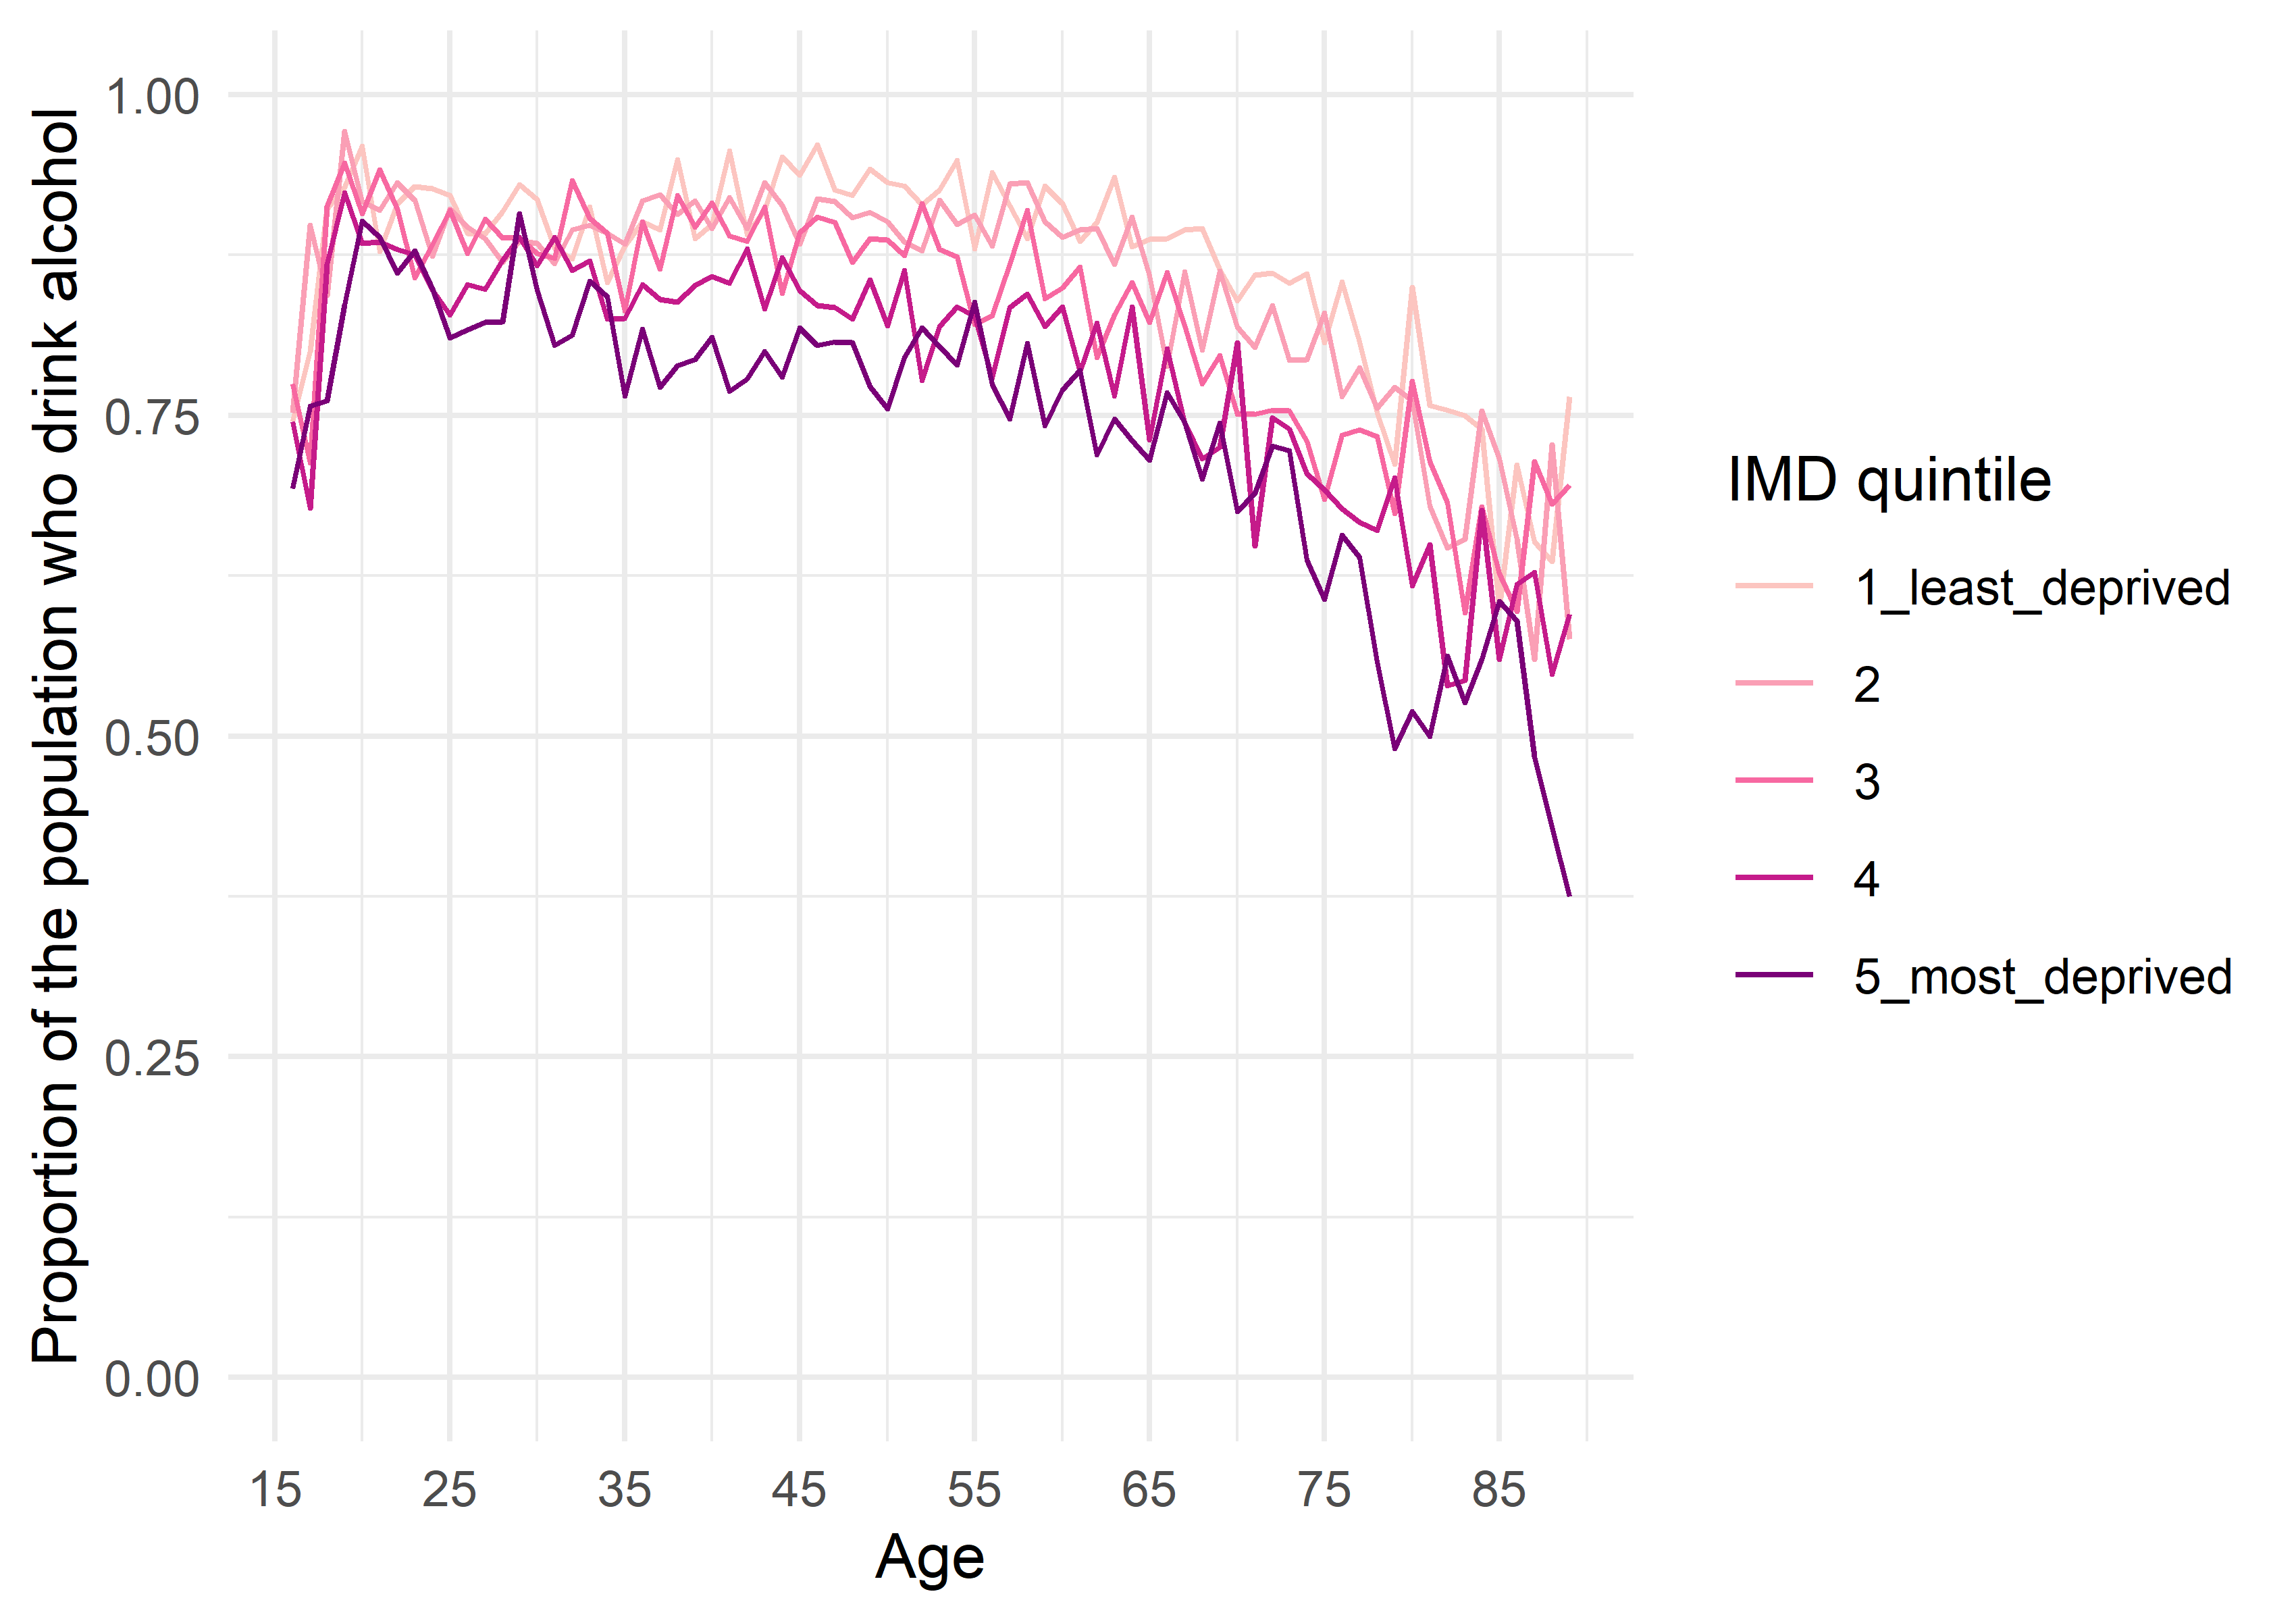
Figure 13. Index of Multiple Deprivation specific age trends in the proportion of people who drink alcohol.
Average weekly alcohol consumption by people who consume some alcohol
In the general population, the average number of UK standard units of alcohol consumed by people who drink at least once or twice a year peaked at 17.35 units at age 19 and fell to 3.59 units at age 89.
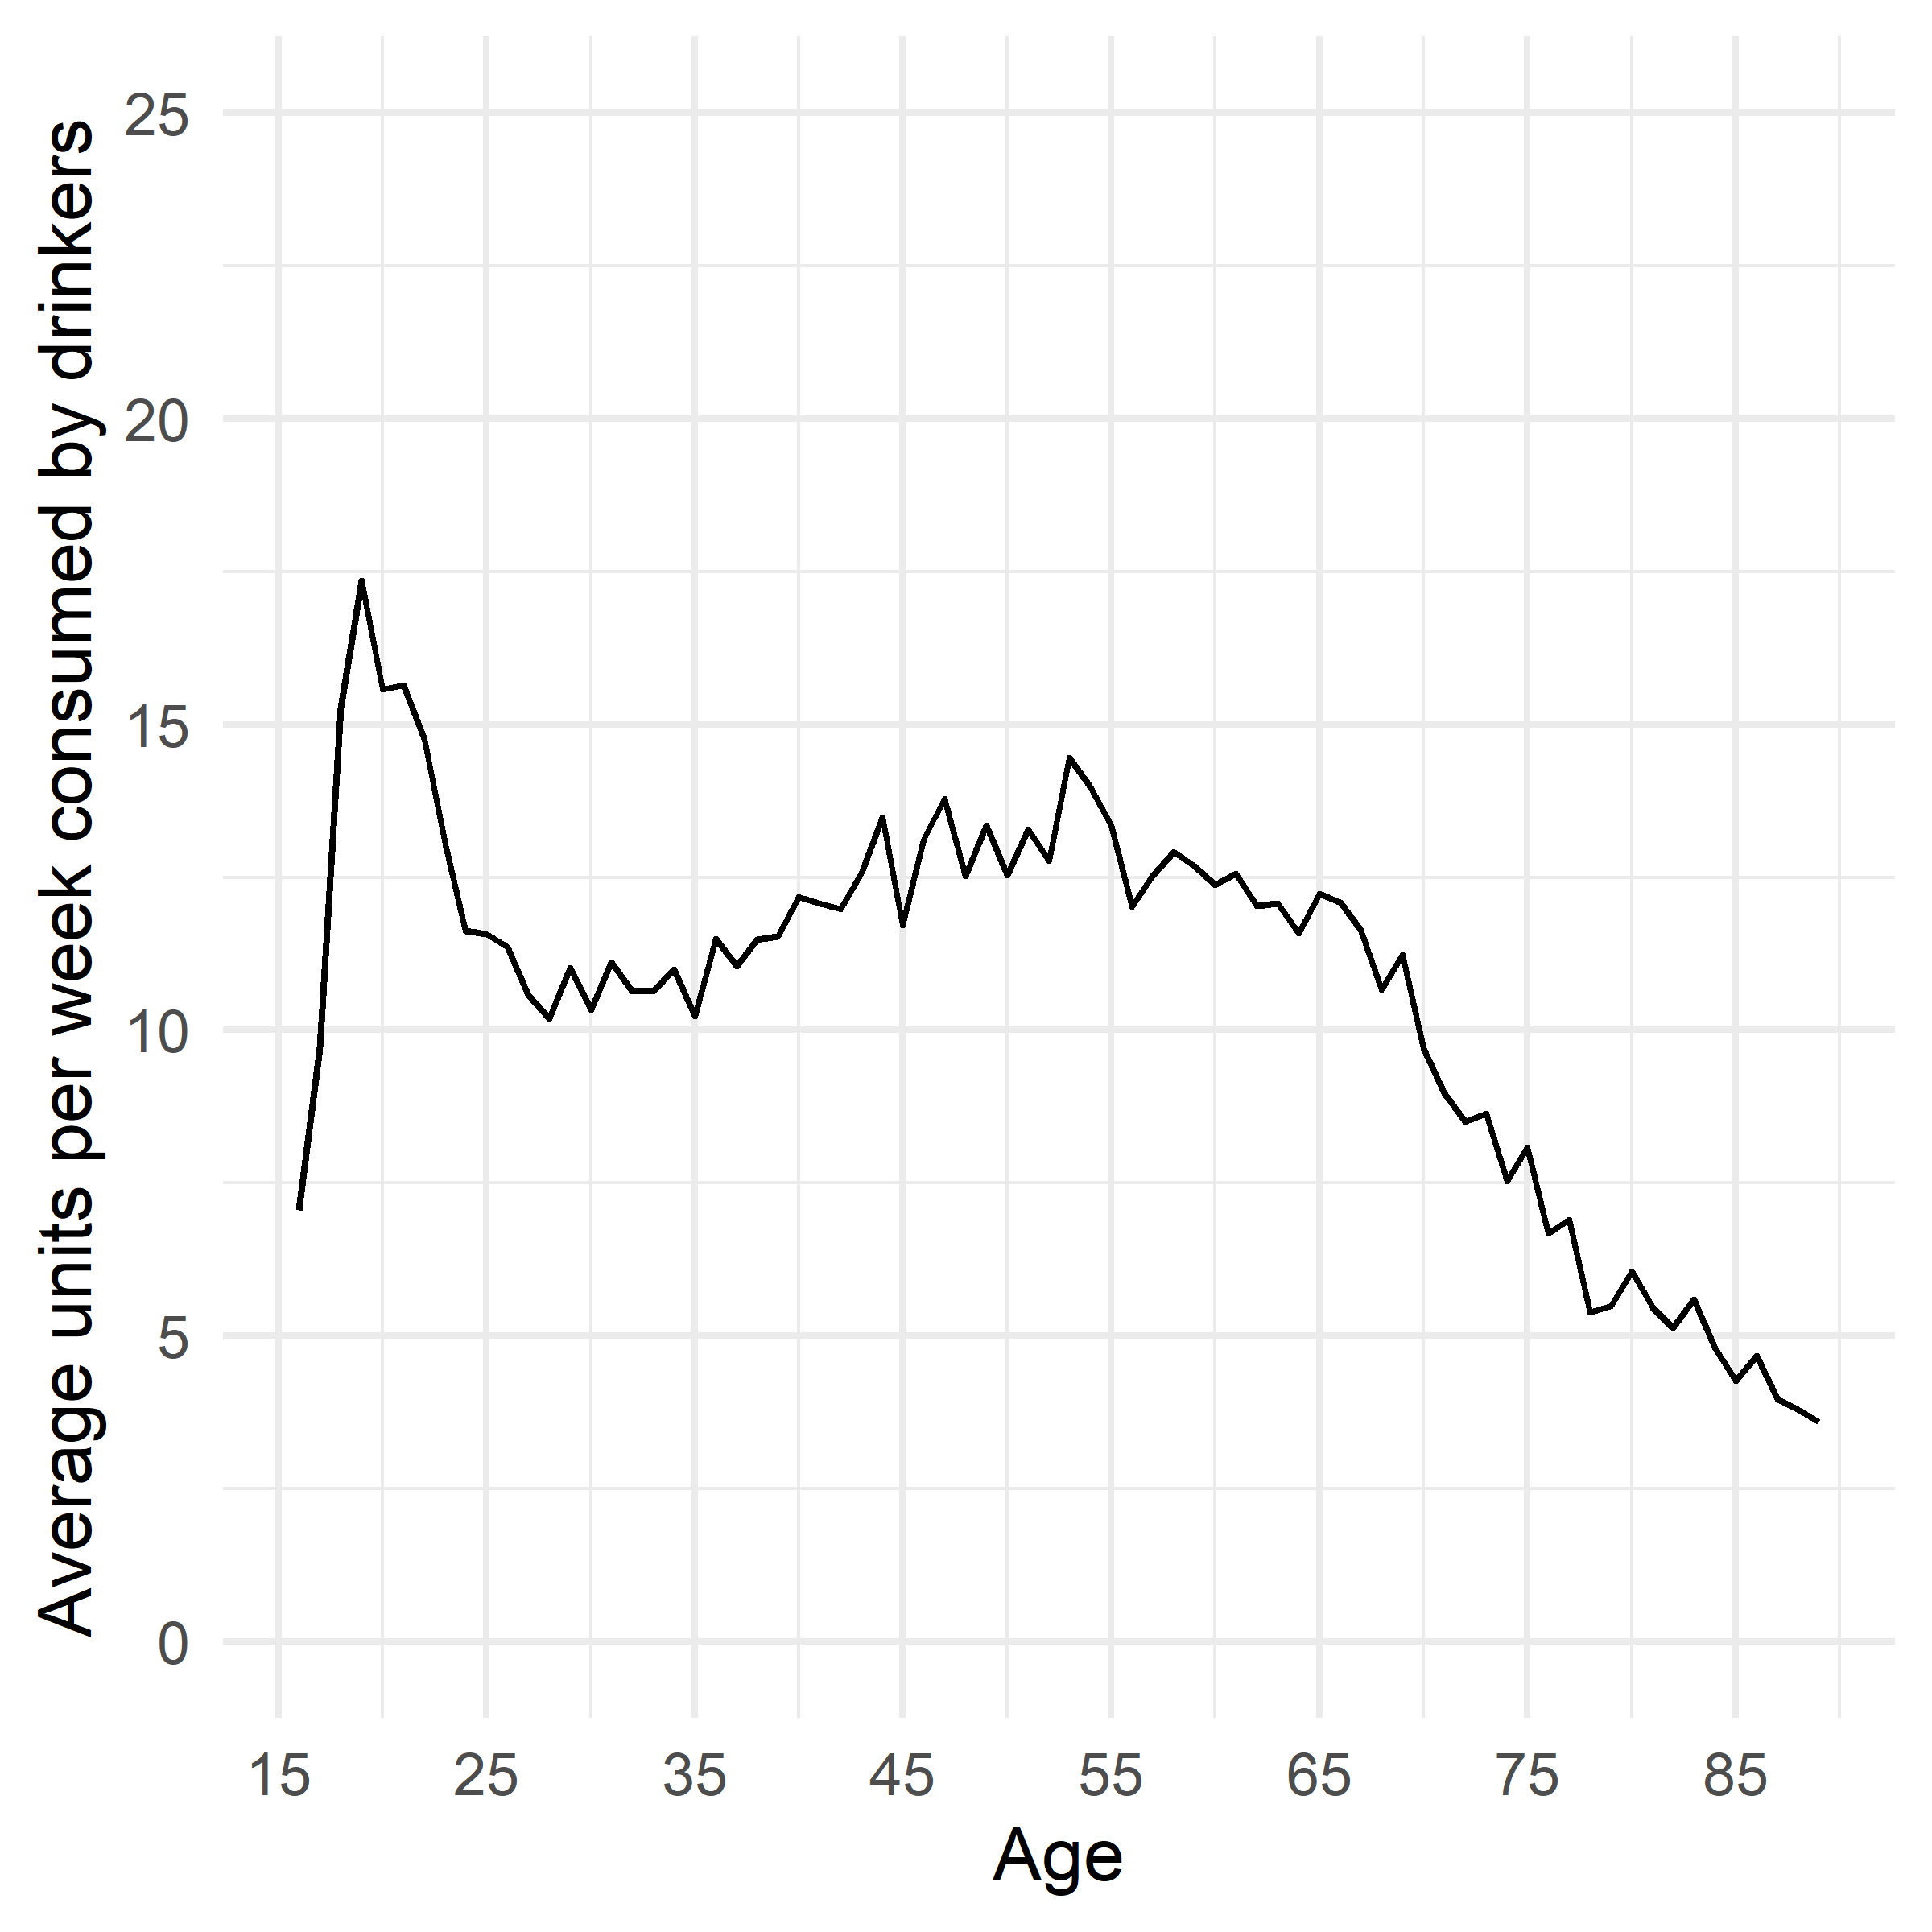
Figure 14. Age trends in the average amount drunk per week by people who drink alcohol.
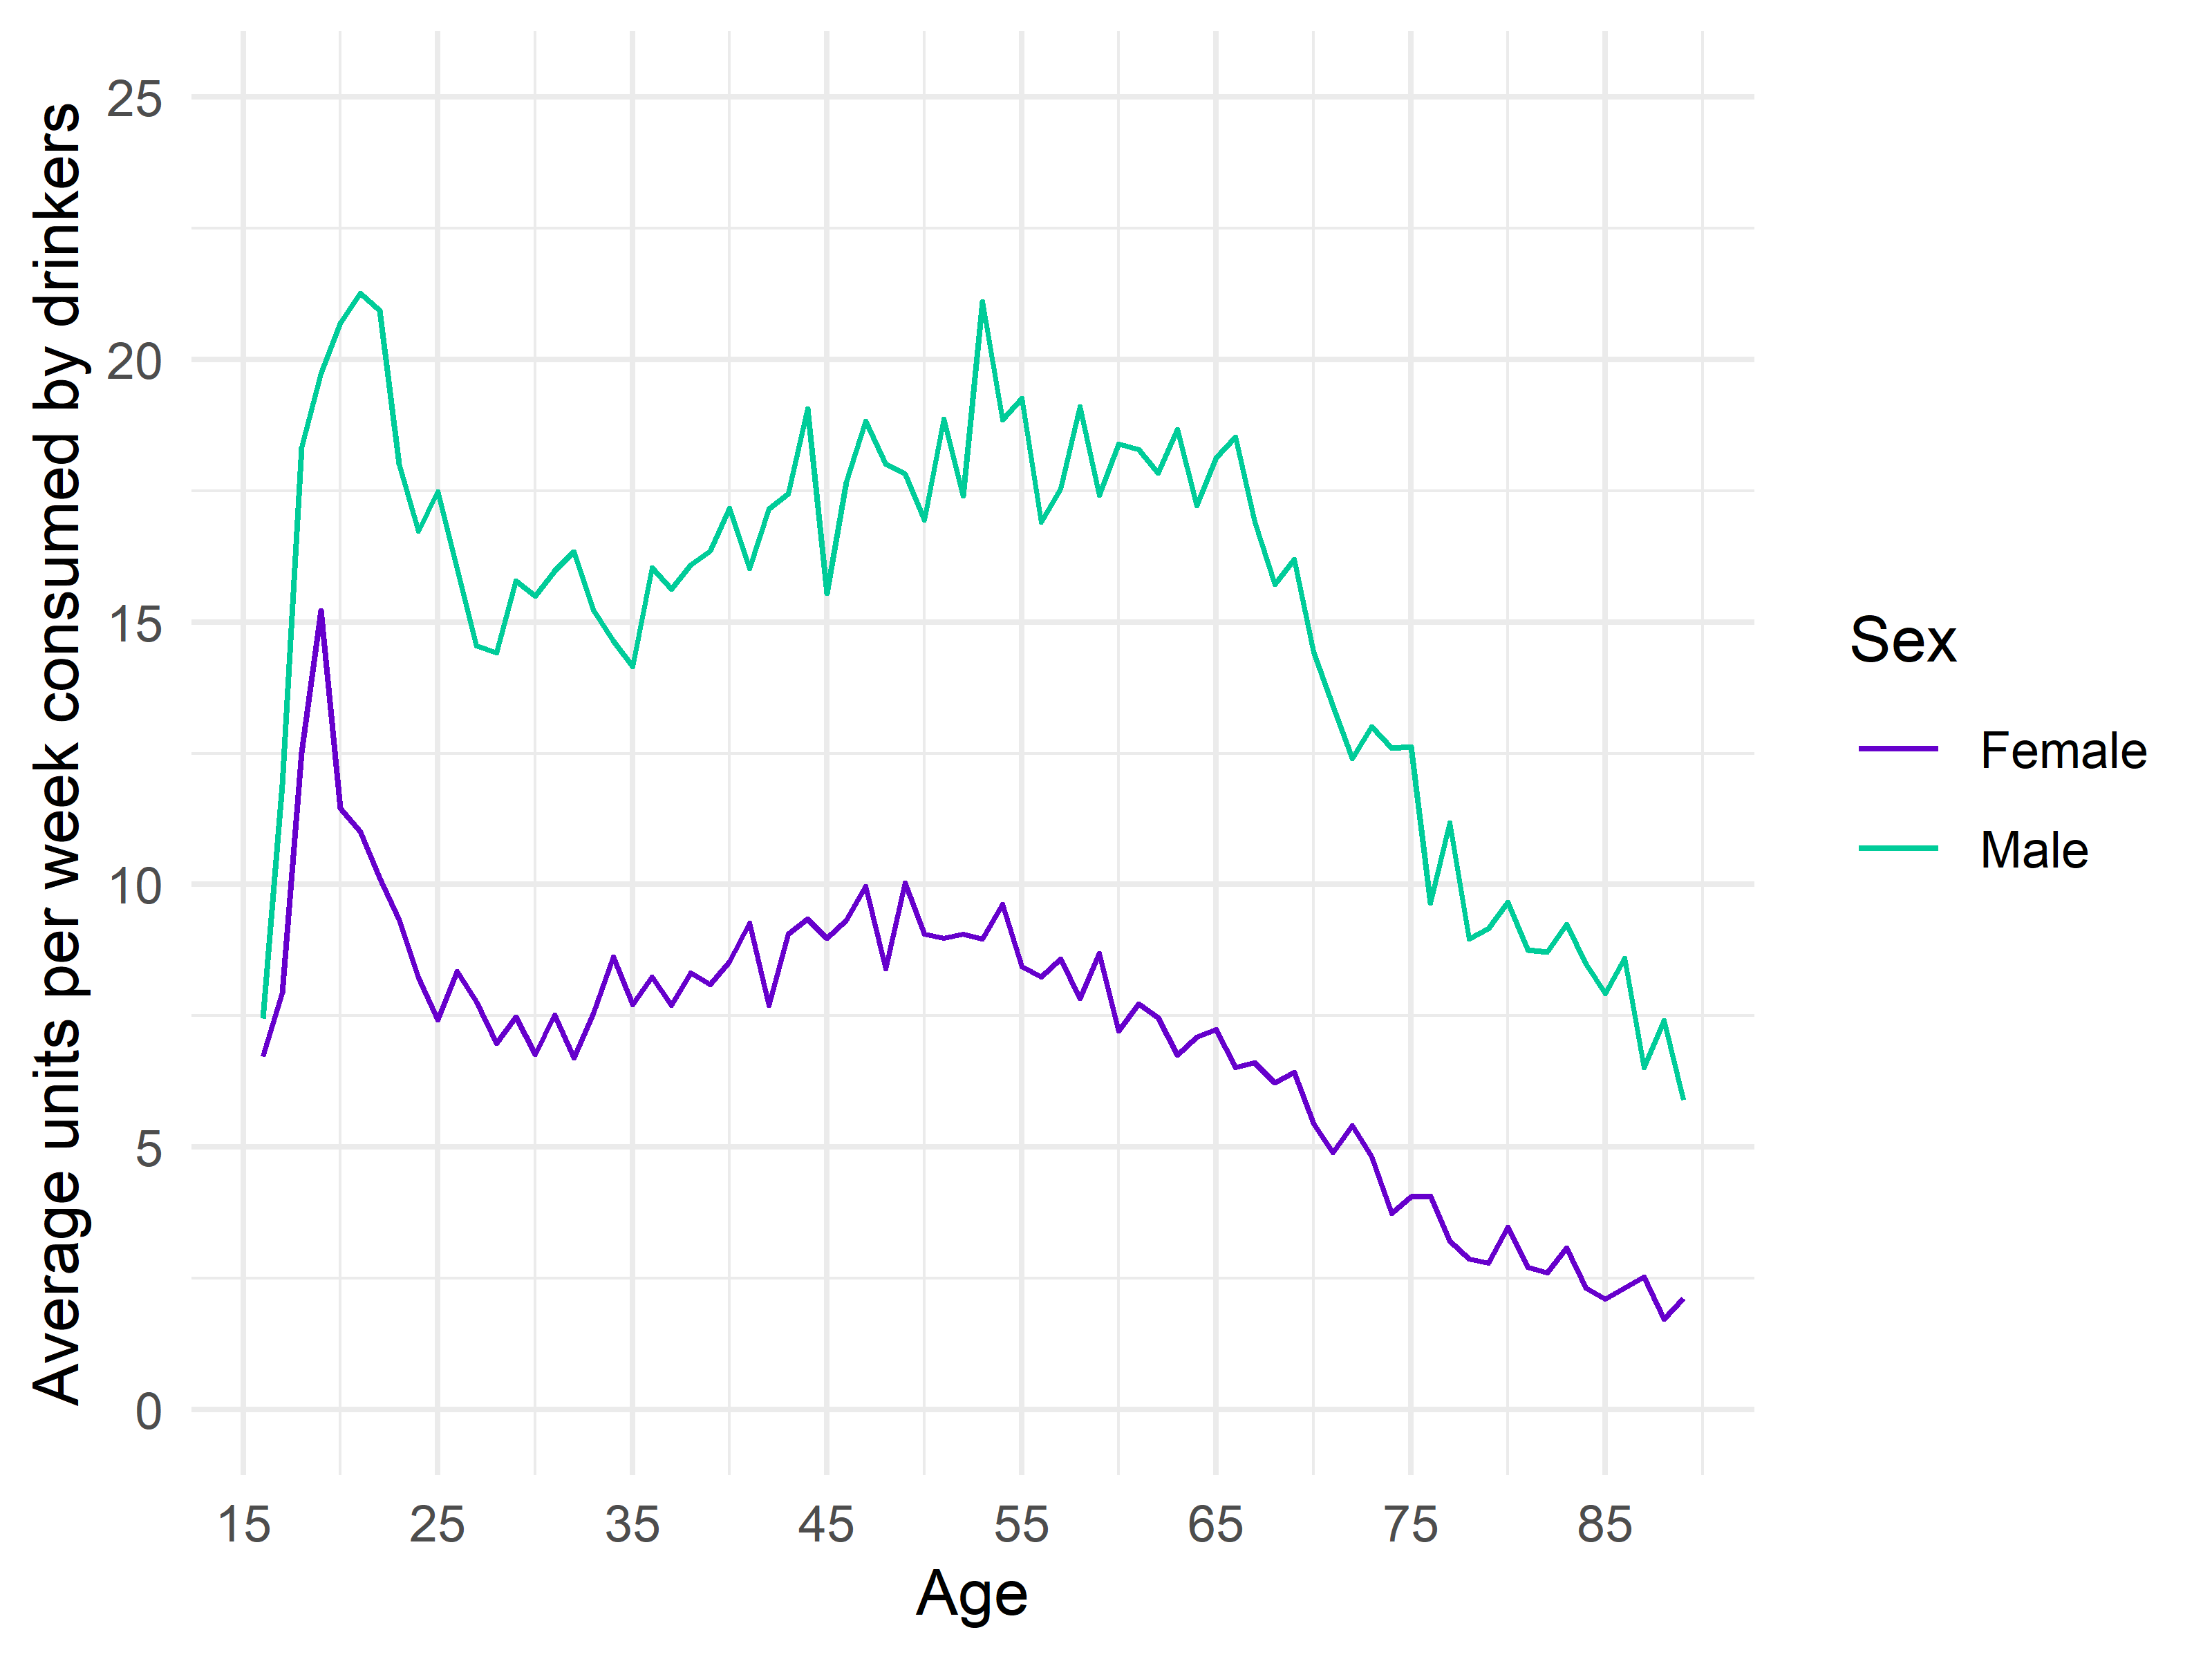
Figure 15. Sex specific age trends in the average amount drunk per week by people who drink alcohol.
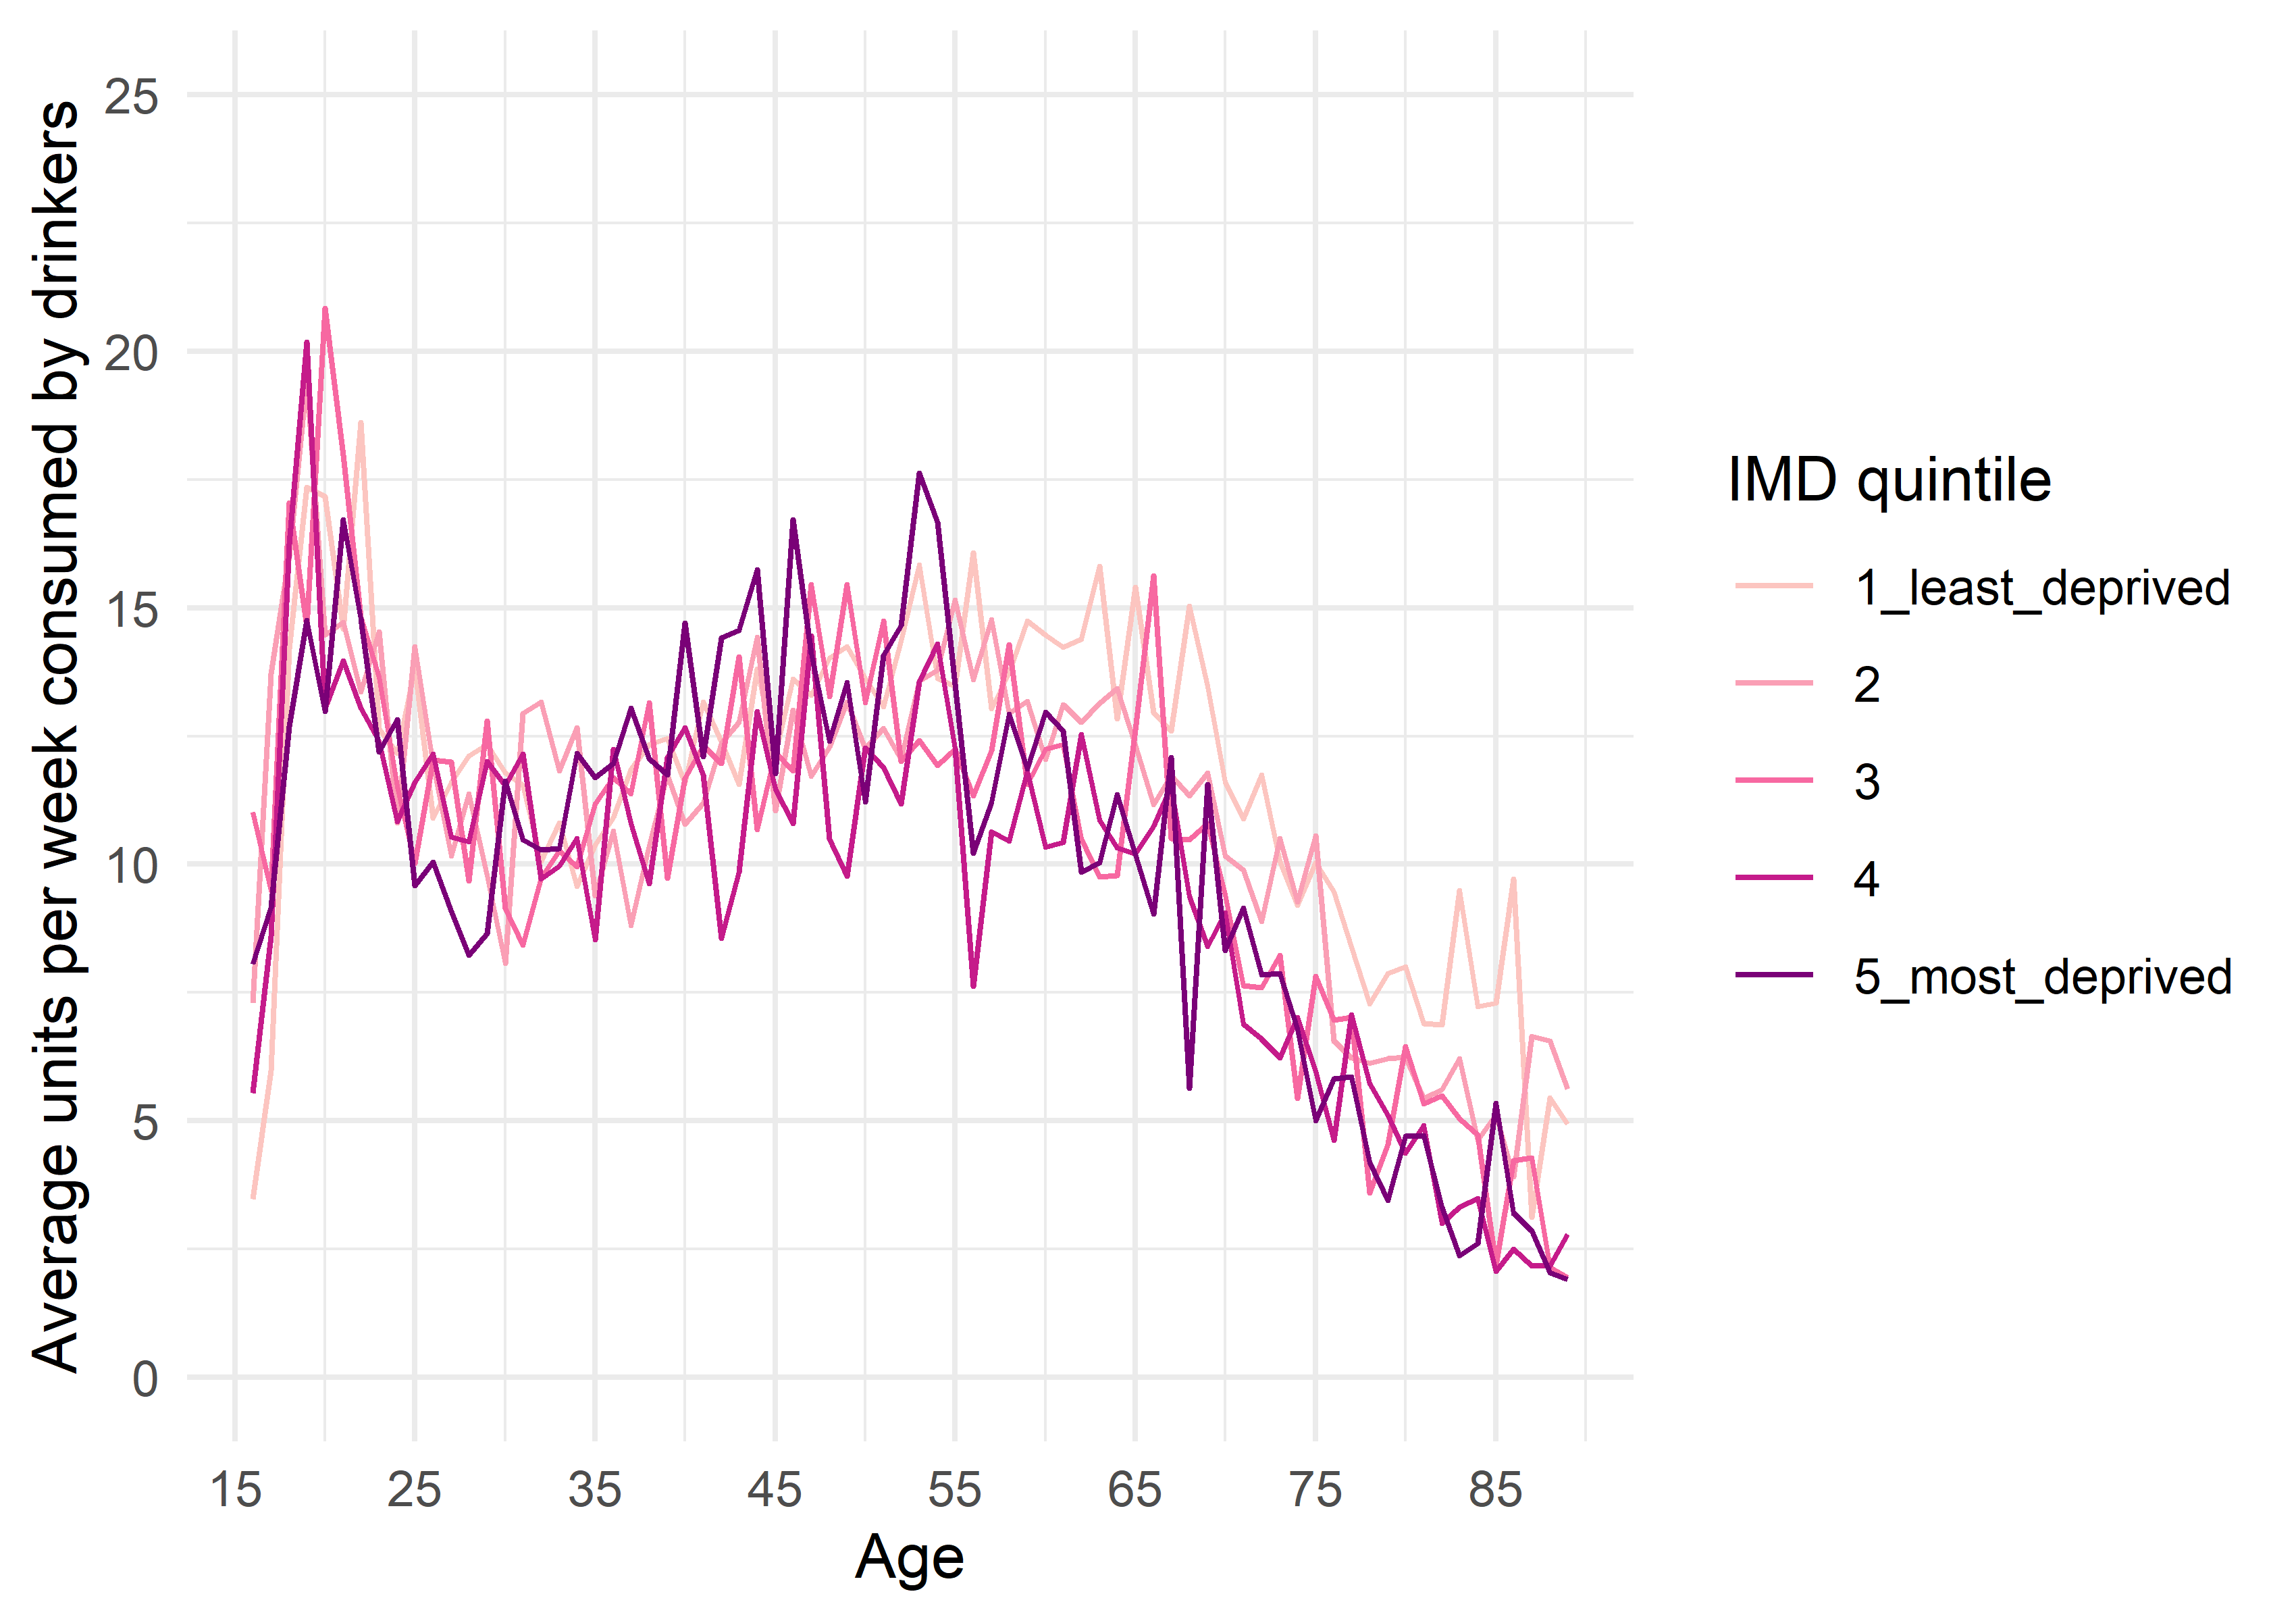
Figure 16. Index of Multiple Deprivation specific age trends in the average amount drunk per week by people who drink alcohol.
Alcohol beverage preferences
The plots below show the proportions of people who drink each type of alcoholic drink. The types of alcoholic drink considered has been reduced to four by combining ‘normal beer’ and ‘strong beer’ into a single ‘beer’ category, and by adding ‘sherry’ into the ‘wine’ category.
Preferences for beer, wine, spirits and alcopops
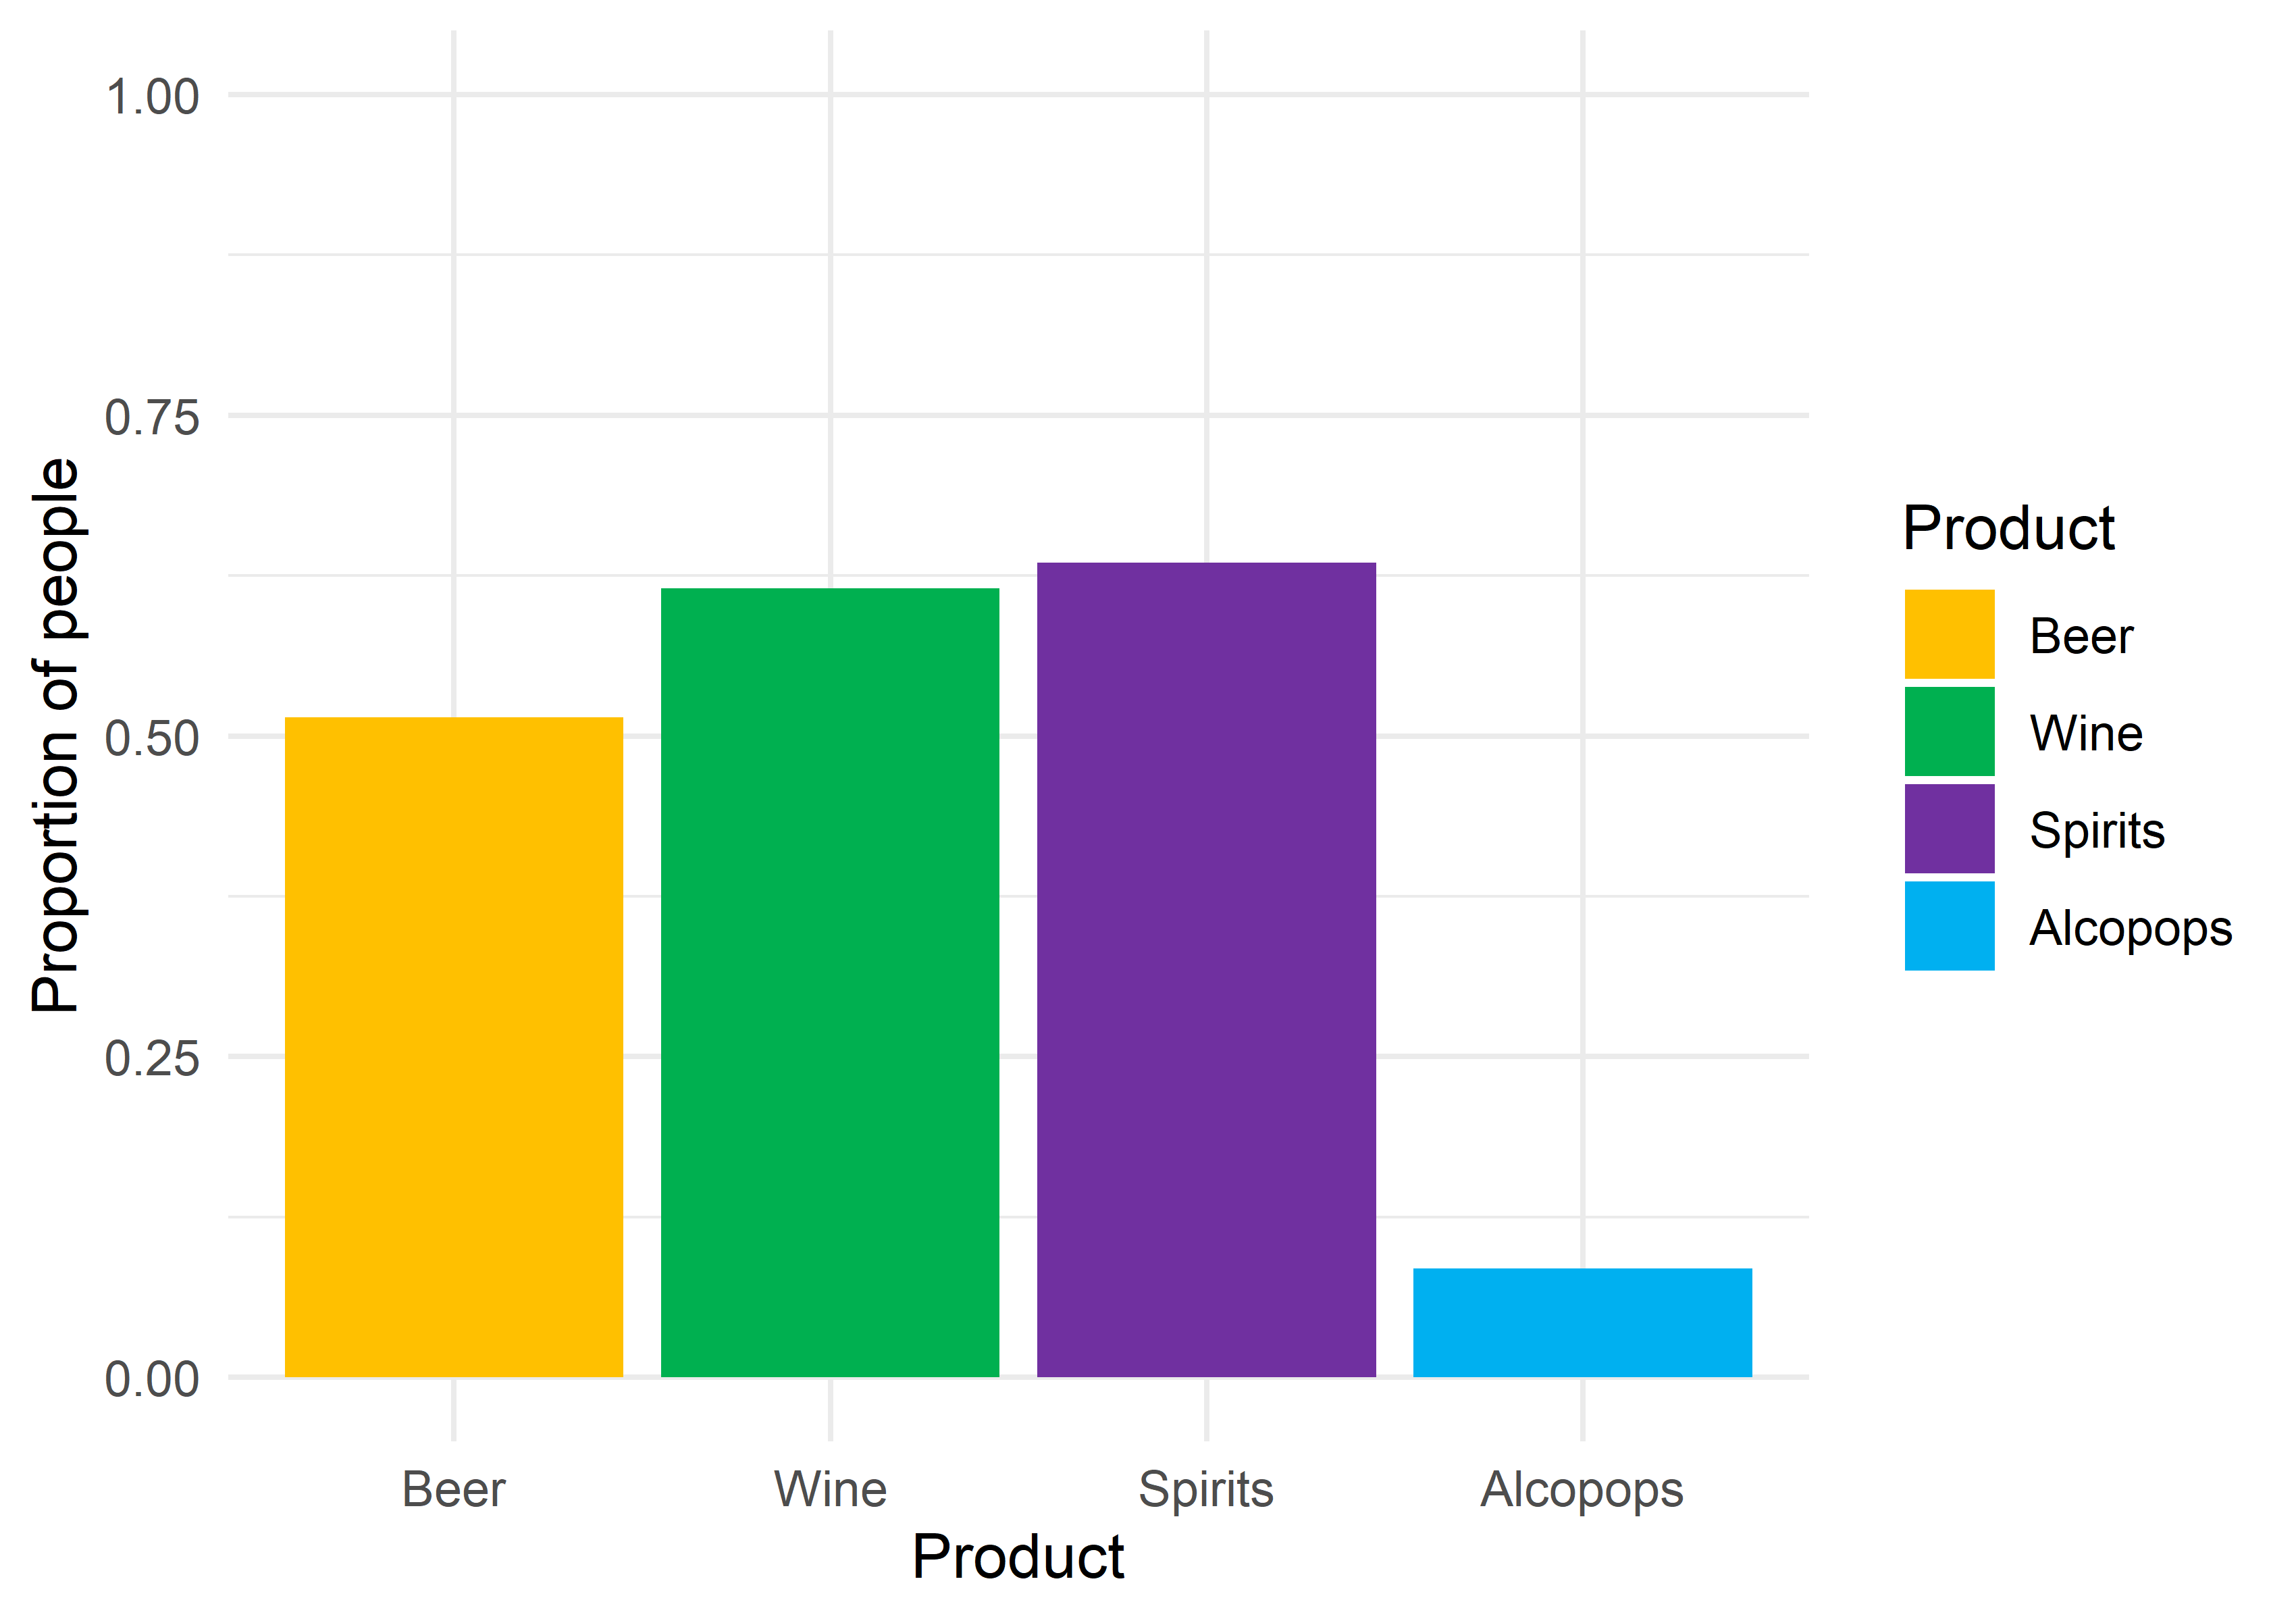
Figure 17. Proportions of people who drink each type of alcoholic drink.
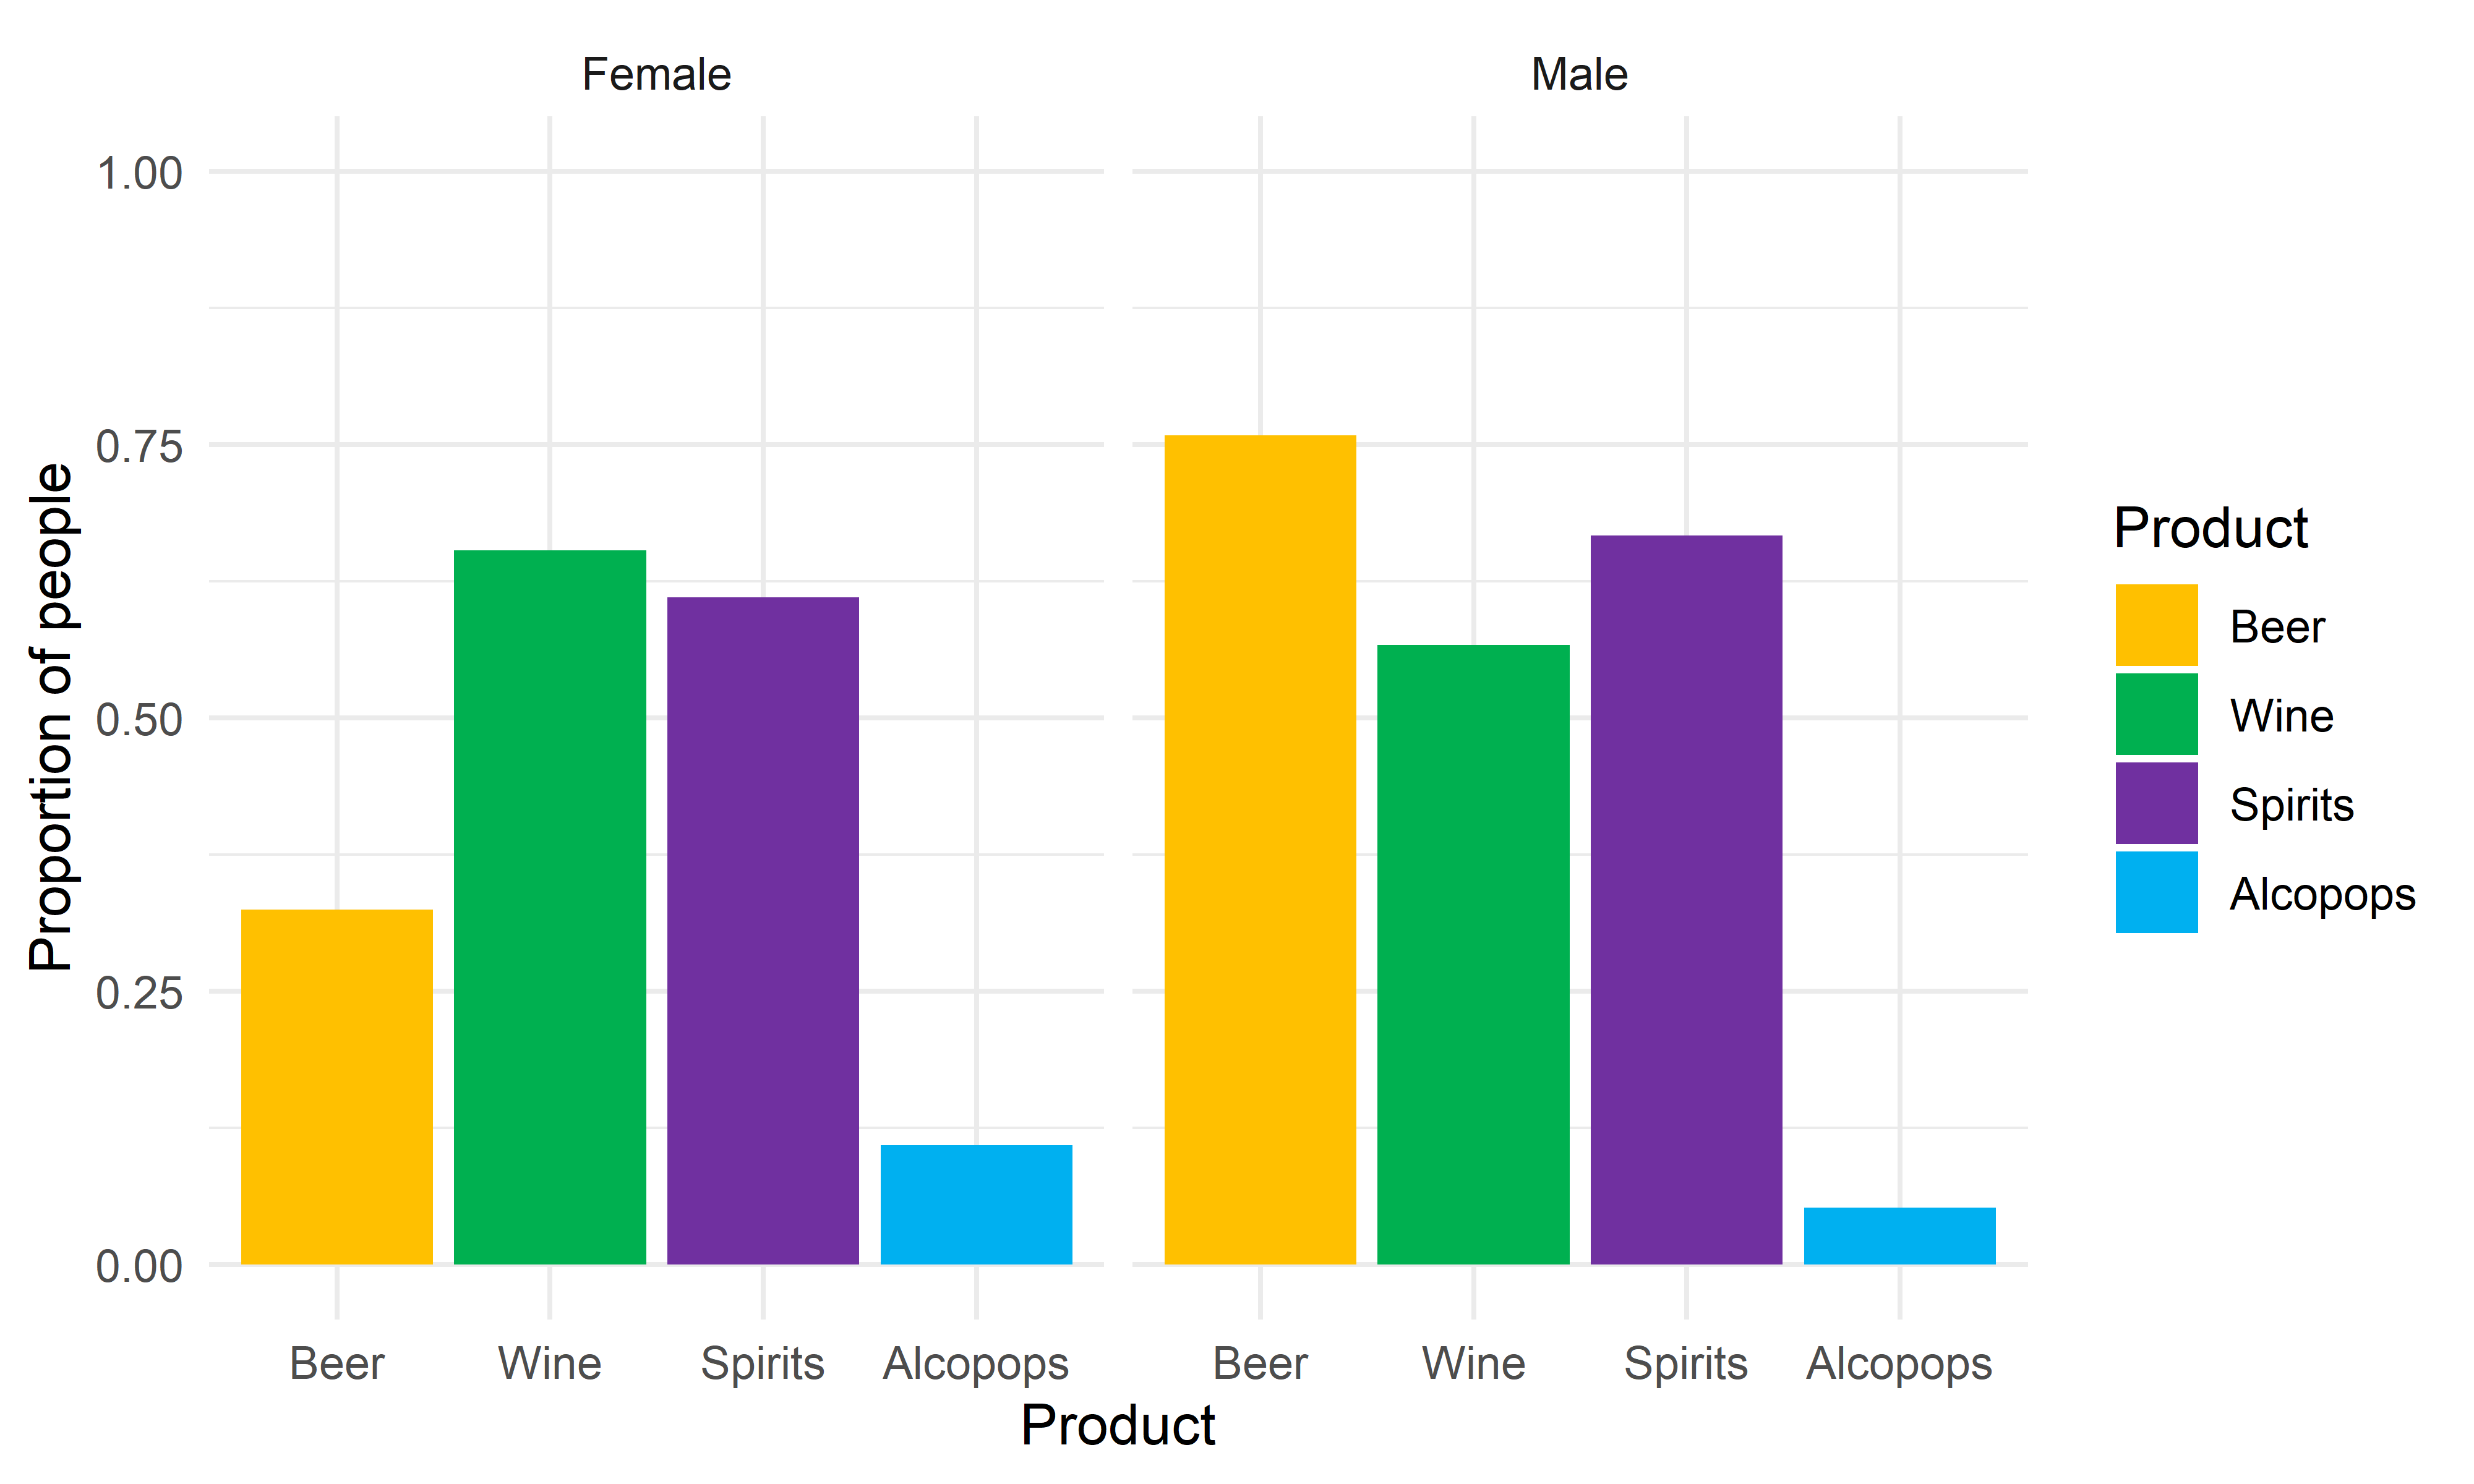
Figure 18. Sex specific proportions of people who drink each type of alcoholic drink.
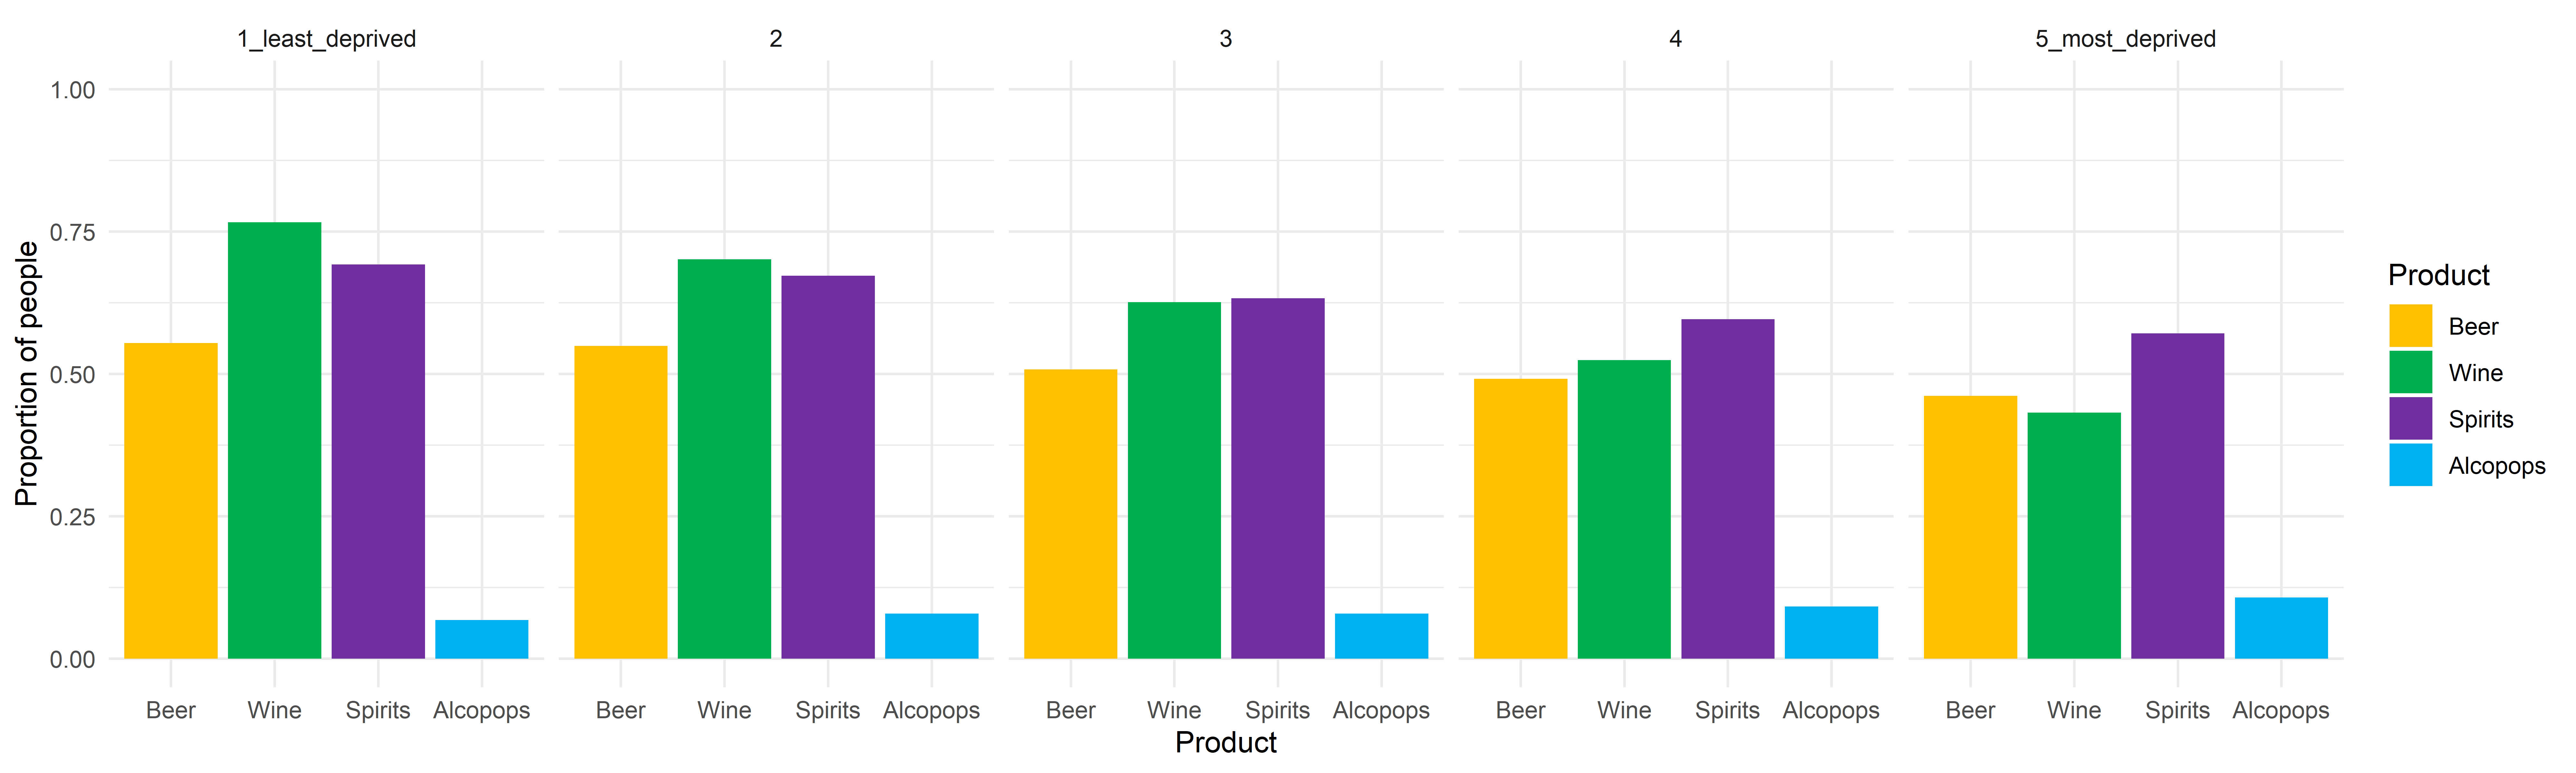
Figure 19. Index of Multiple Deprivation quintile specific proportions of people who drink each type of alcoholic drink.

Reproducibility notes
- Data processed using hseclean version 1.11.3 (open access)
- Github code repository https://github.com/STAPM/hseclean. Code for these plots https://github.com/STAPM/hseclean/tree/master/vignettes/Scotland_alcohol_data
- Open Science Framework repository https://osf.io/43n7p/