Data check: Tobacco consumption in the Scottish Health Survey
Scotland_tobacco_data_report.RmdClick here to go to the Scottish Health Survey data page on the STAPM website
The purpose of this document
To plot the data processed using functions in the hseclean package as part of the process of quality assurance of the preparation of input data used in the tobacco component of the STAPM modelling for Scotland. This document comprises exploratory plots to illustrate the SHeS data on tobacco consumption and plots that we use to check the processing of the data using hseclean.
Background
The Scottish Health Survey (SHeS) is a survey of the health and health-related behaviours of private households in Scotland that has been carried out annually since 2008. It is the main source of data on tobacco consumption used to inform the tobacco component of the Sheffield Tobacco and Alcohol Policy Modelling. The survey asks respondents about whether they currently smoke cigarettes, and if they do how many cigarettes they consume on a typical day. The survey also asks about the age at which someone started to smoke, and if they are a former smoker, the age at which they quit smoking.
Since 2013, the Health Survey for England has asked a question to ascertain the division of the number of cigarettes smoked per day between machine-rolled and hand-rolled cigarettes. However, the Scottish Health Survey does not ask such a question. The Scottish Health Survey does ask how much handrolling tobacco someone smokes on a typical day, but only if they prefer to answer the question on amount smoked in terms of weight of tobacco rather than number of cigarettes. This data is converted to an estimated number of cigarettes smoked assuming that one cigarette contains 0.5 grammes of tobacco. Due to the non-representative data on each smoker’s split in tobacco consumption between machine-rolled and hand-rolled cigarettes, this data check does not include a plot to illustrate the preference for different cigarette types.
The SHeS data is processed for use in the STAPM modelling by standardised and version controlled R code functions in the hseclean R package. Project specific code draws on these functions to process the SHeS data into STAPM inputs.
Data checks conducted
Data checks are conducted on a pooled sample of all calendar years of the SHeS data from 2008 to 2019. Survey weights are not applied, i.e. the plots show the distribution of alcohol consumption in the survey sample rather than applying weights to adjust for survey design or non-response rates.
- Distribution of the population among current, former and never
smoker states for (a) the overall population aged 16 to 89 years, (b) by
sex, (c) by Scottish Index of Multiple Deprivation quintiles
- Calendar year trend in the distribution of the population among
current, former and never smoker states
- Age trend in the distribution of the population among current,
former and never smoker states
- Distribution of the age started smoking for (a) the overall
population aged 16 to 89 years, (b) by sex, (c) by Scottish Index of
Multiple Deprivation quintiles
- Distribution of the average number of cigarettes smoked per day by
current smokers for (a) the overall population aged 16 to 89 years, (b)
by sex, (c) by Scottish Index of Multiple Deprivation quintiles
- Distribution of the number of years since quitting smoking by former smokers for (a) the overall population aged 16 to 89 years, (b) by sex, (c) by Scottish Index of Multiple Deprivation quintiles
Distribution of the population by cigarette smoking status
These plots show the proportion of the population in each smoking state for people aged from 16 to 89 years in the SHeS survey samples from 2008 to 2019.
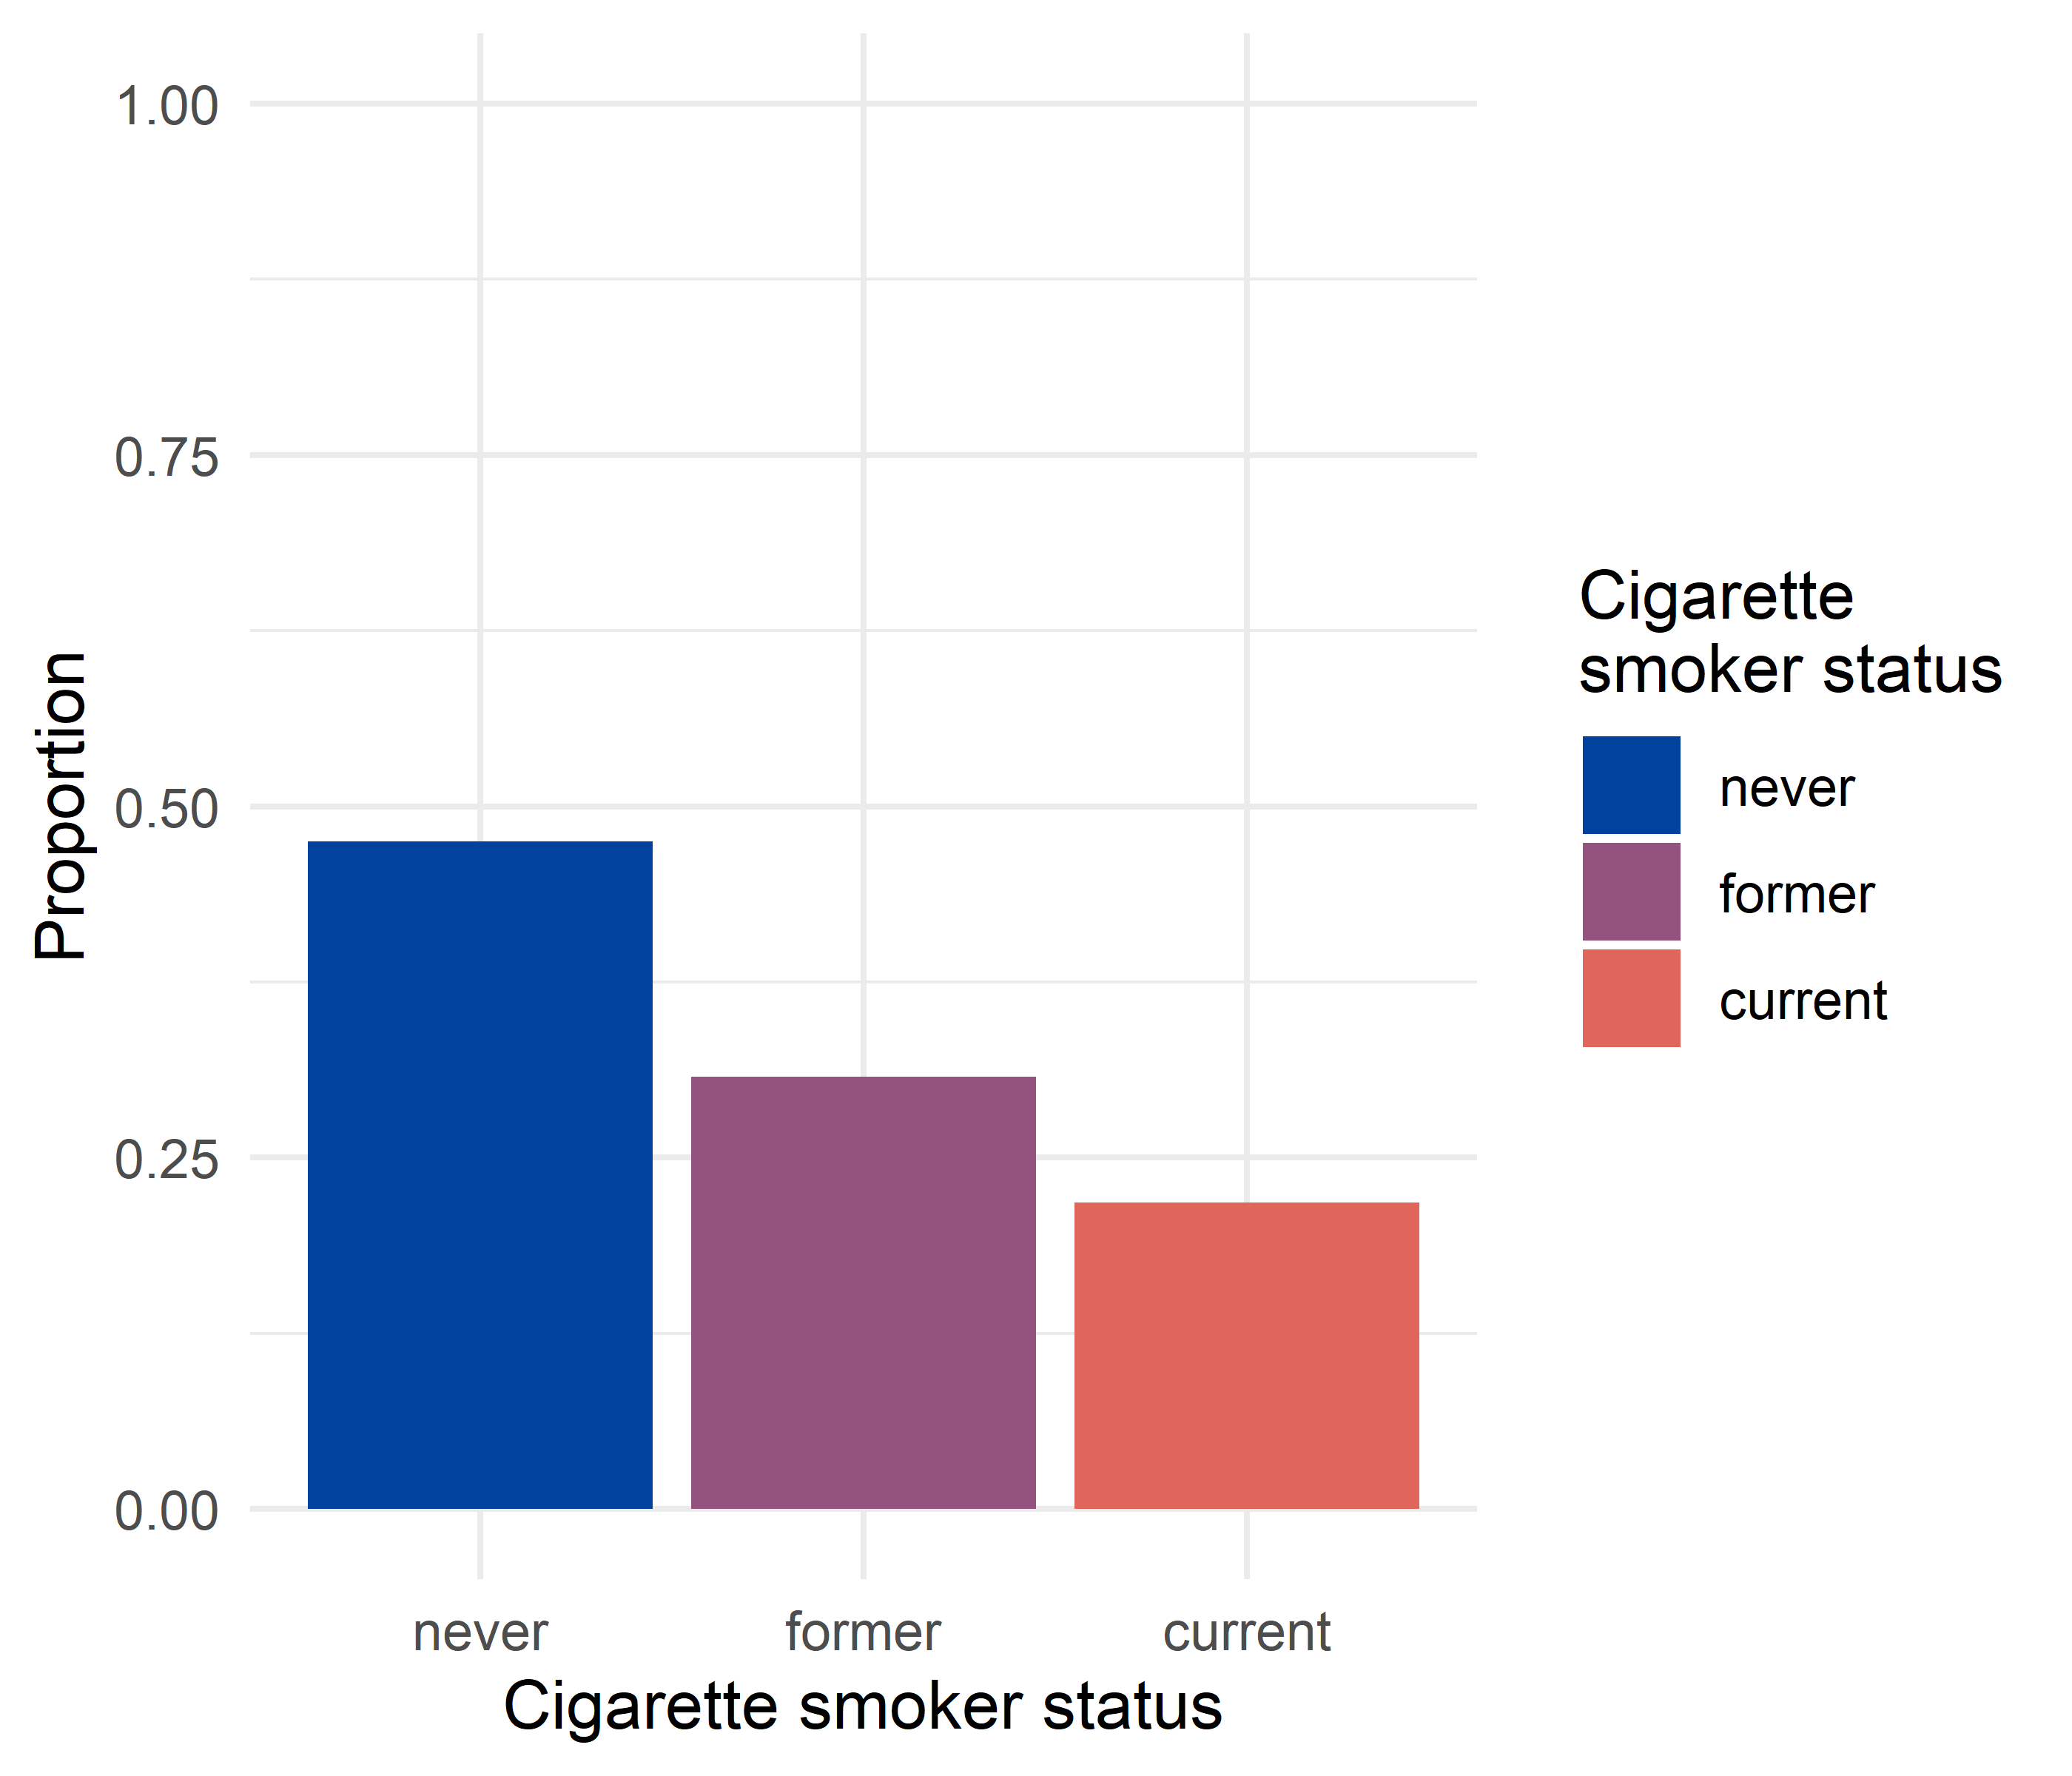
Figure 1. Distribution of the population by cigarette smoker status.

Figure 2. Sex specific distribution of the population by cigarette smoker status.
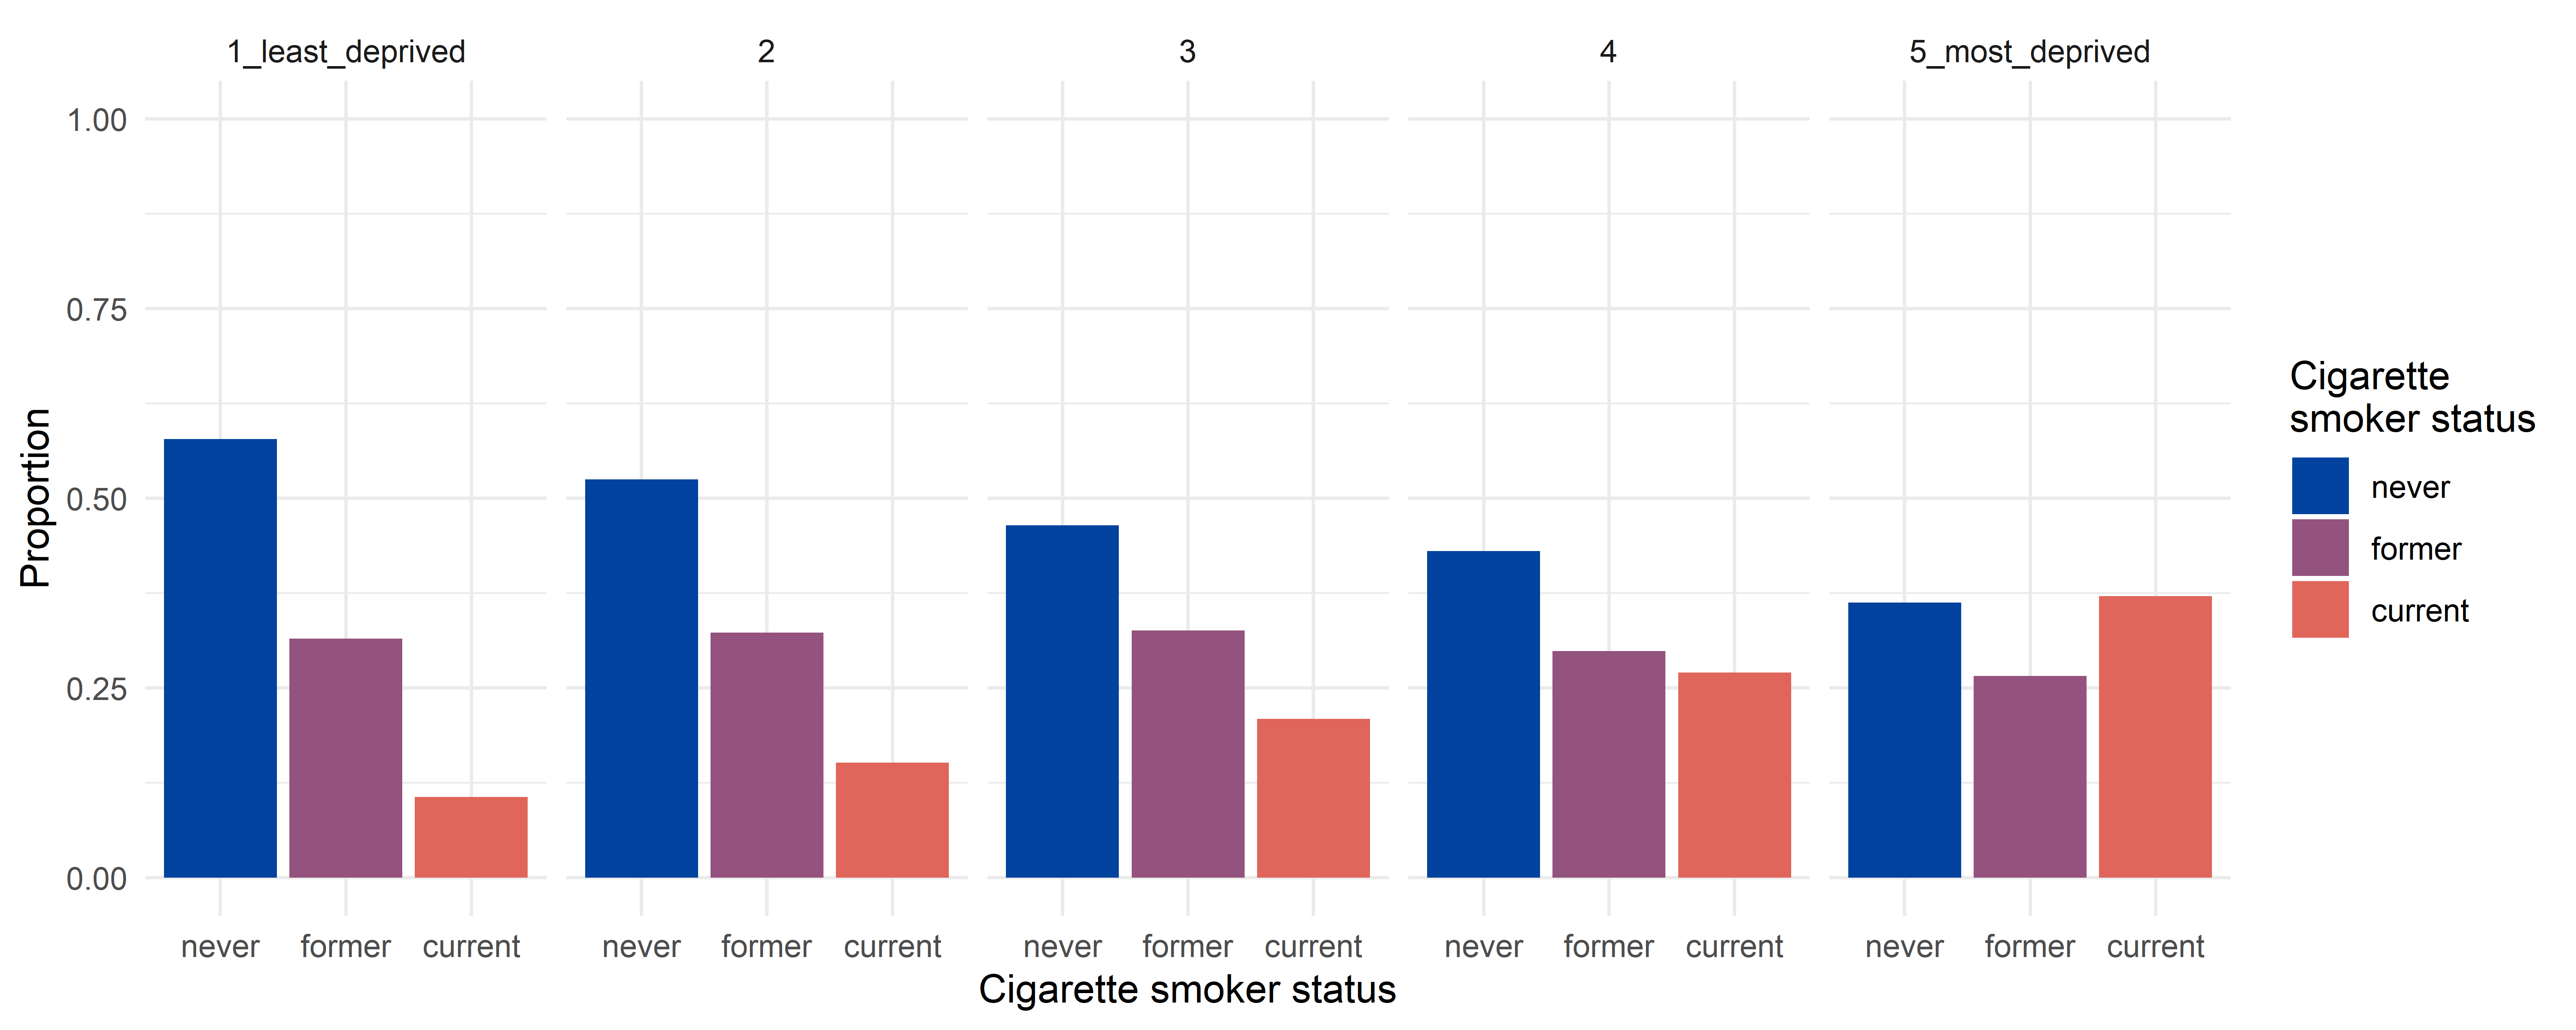
Figure 3. Index of Multiple Deprivation quintile specific distribution of the population by cigarette smoker status.
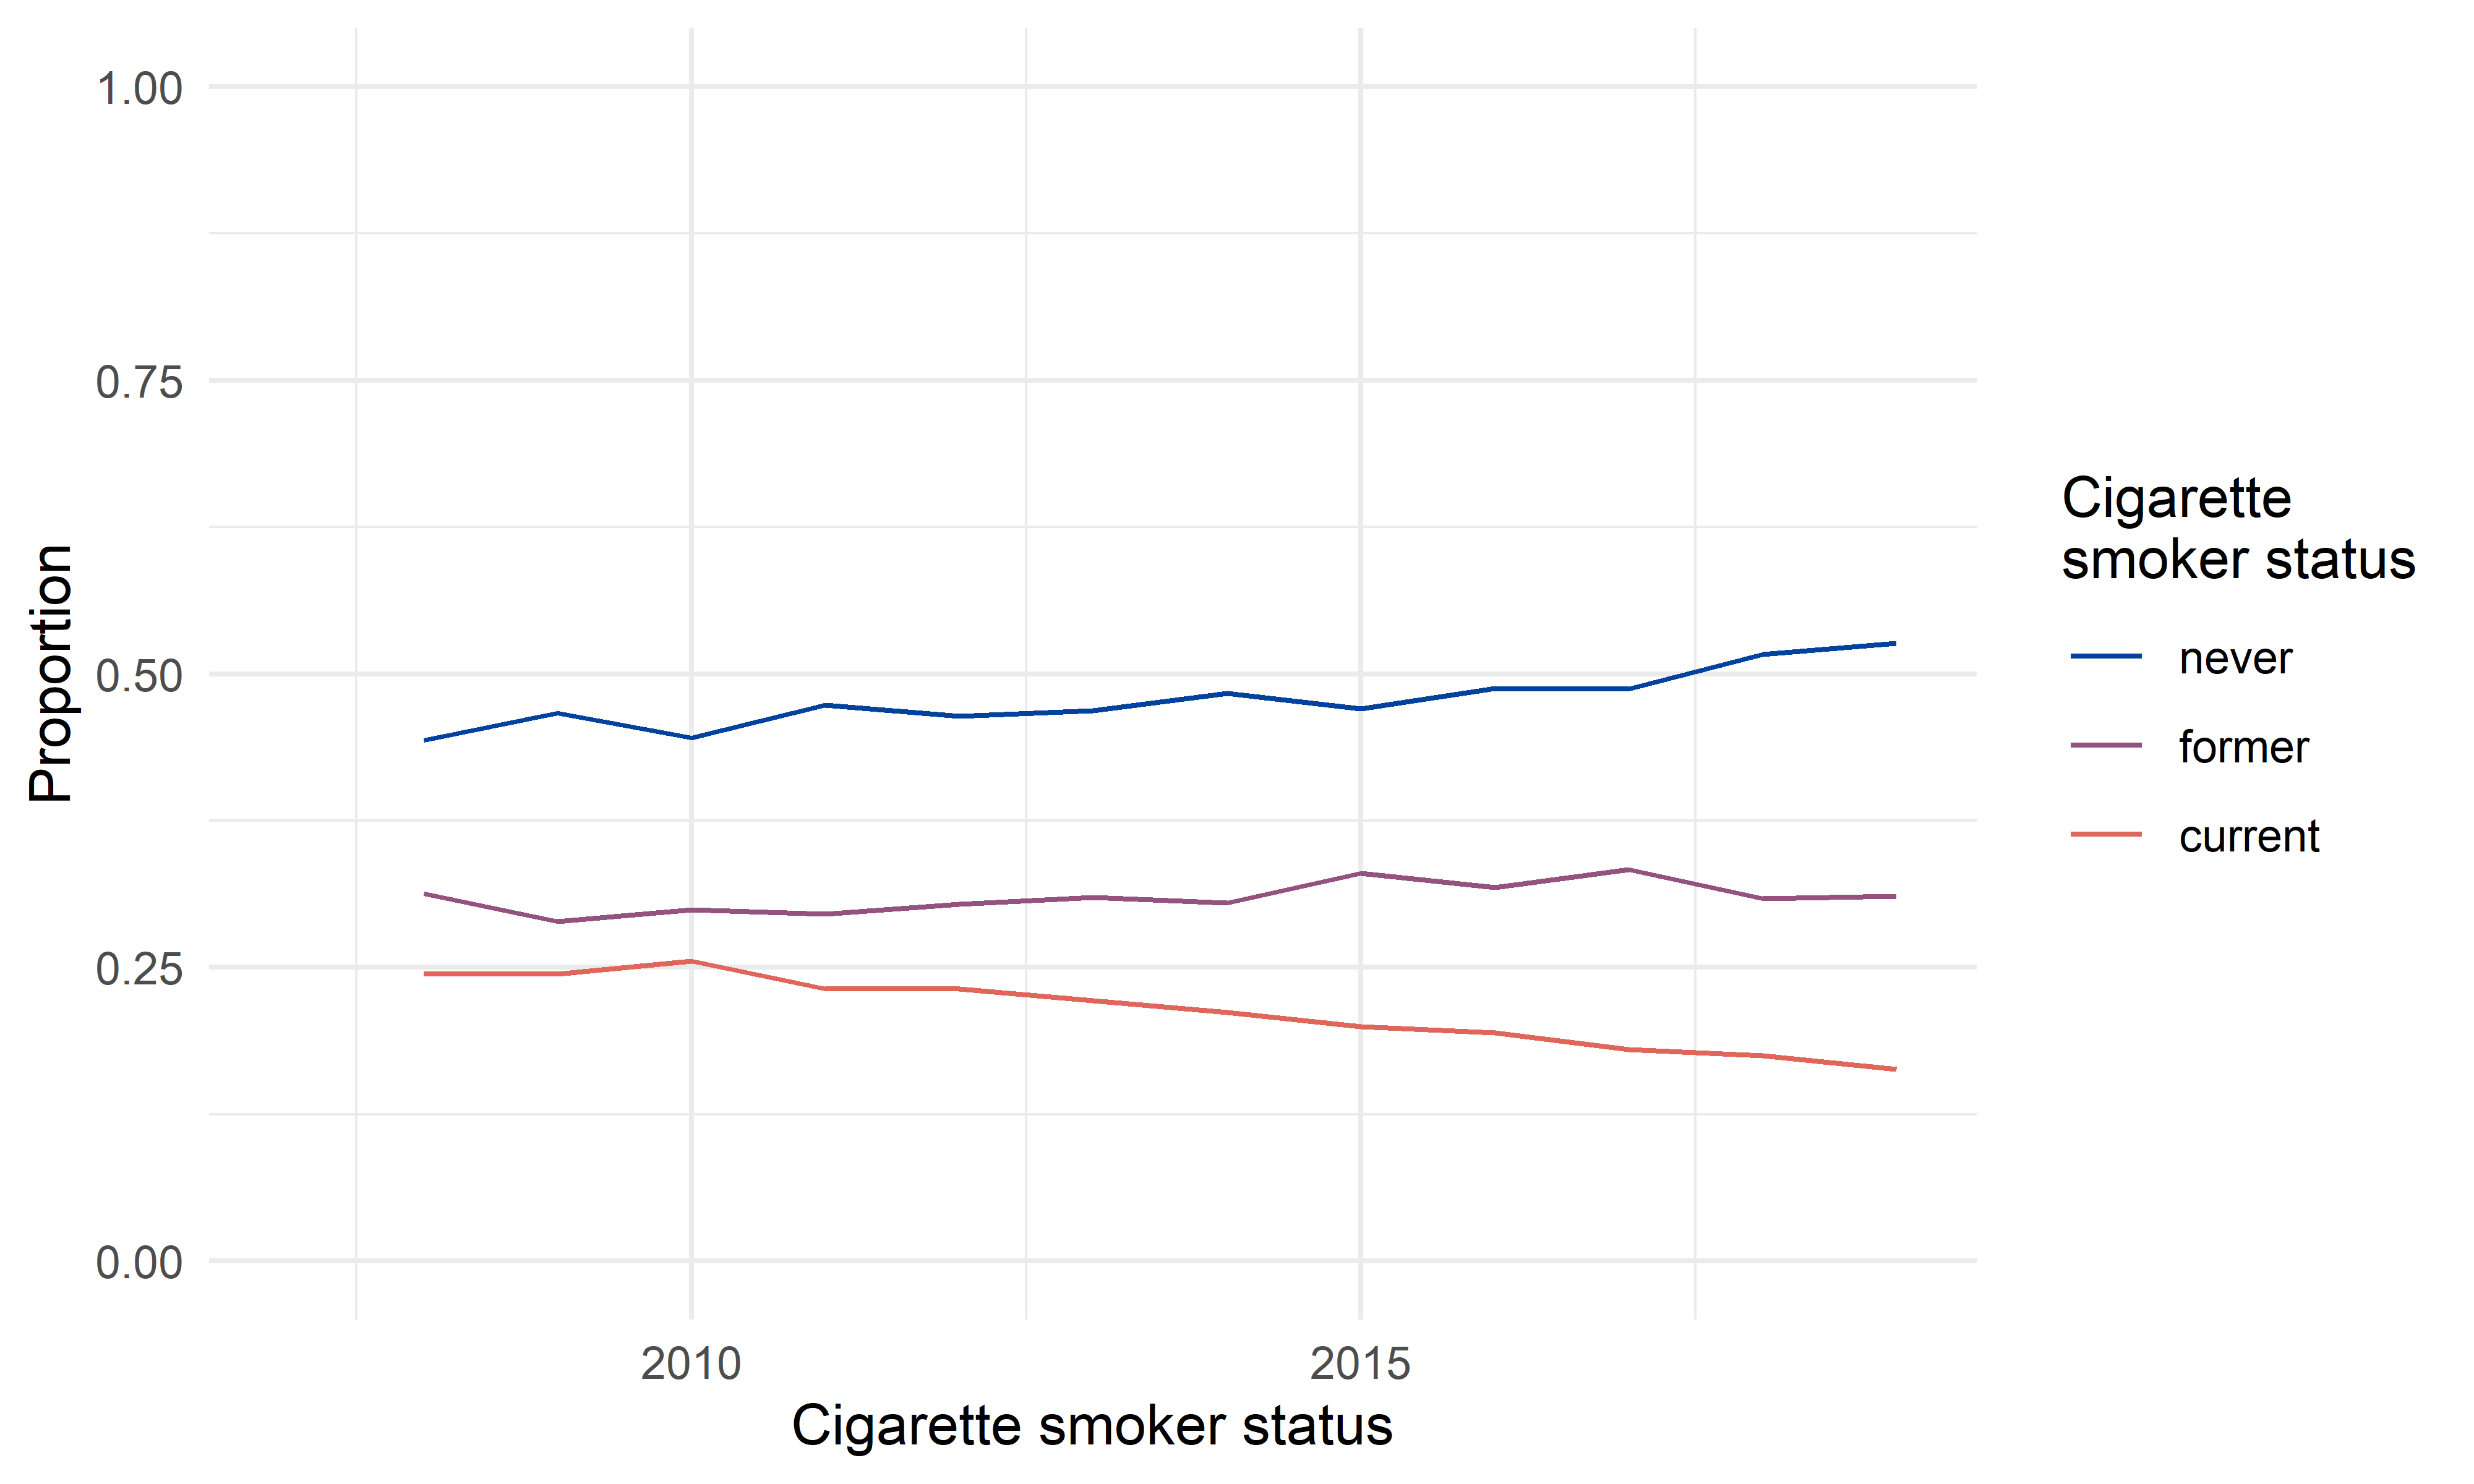
Figure 4. Calendar year specific distribution of the population by cigarette smoker status.
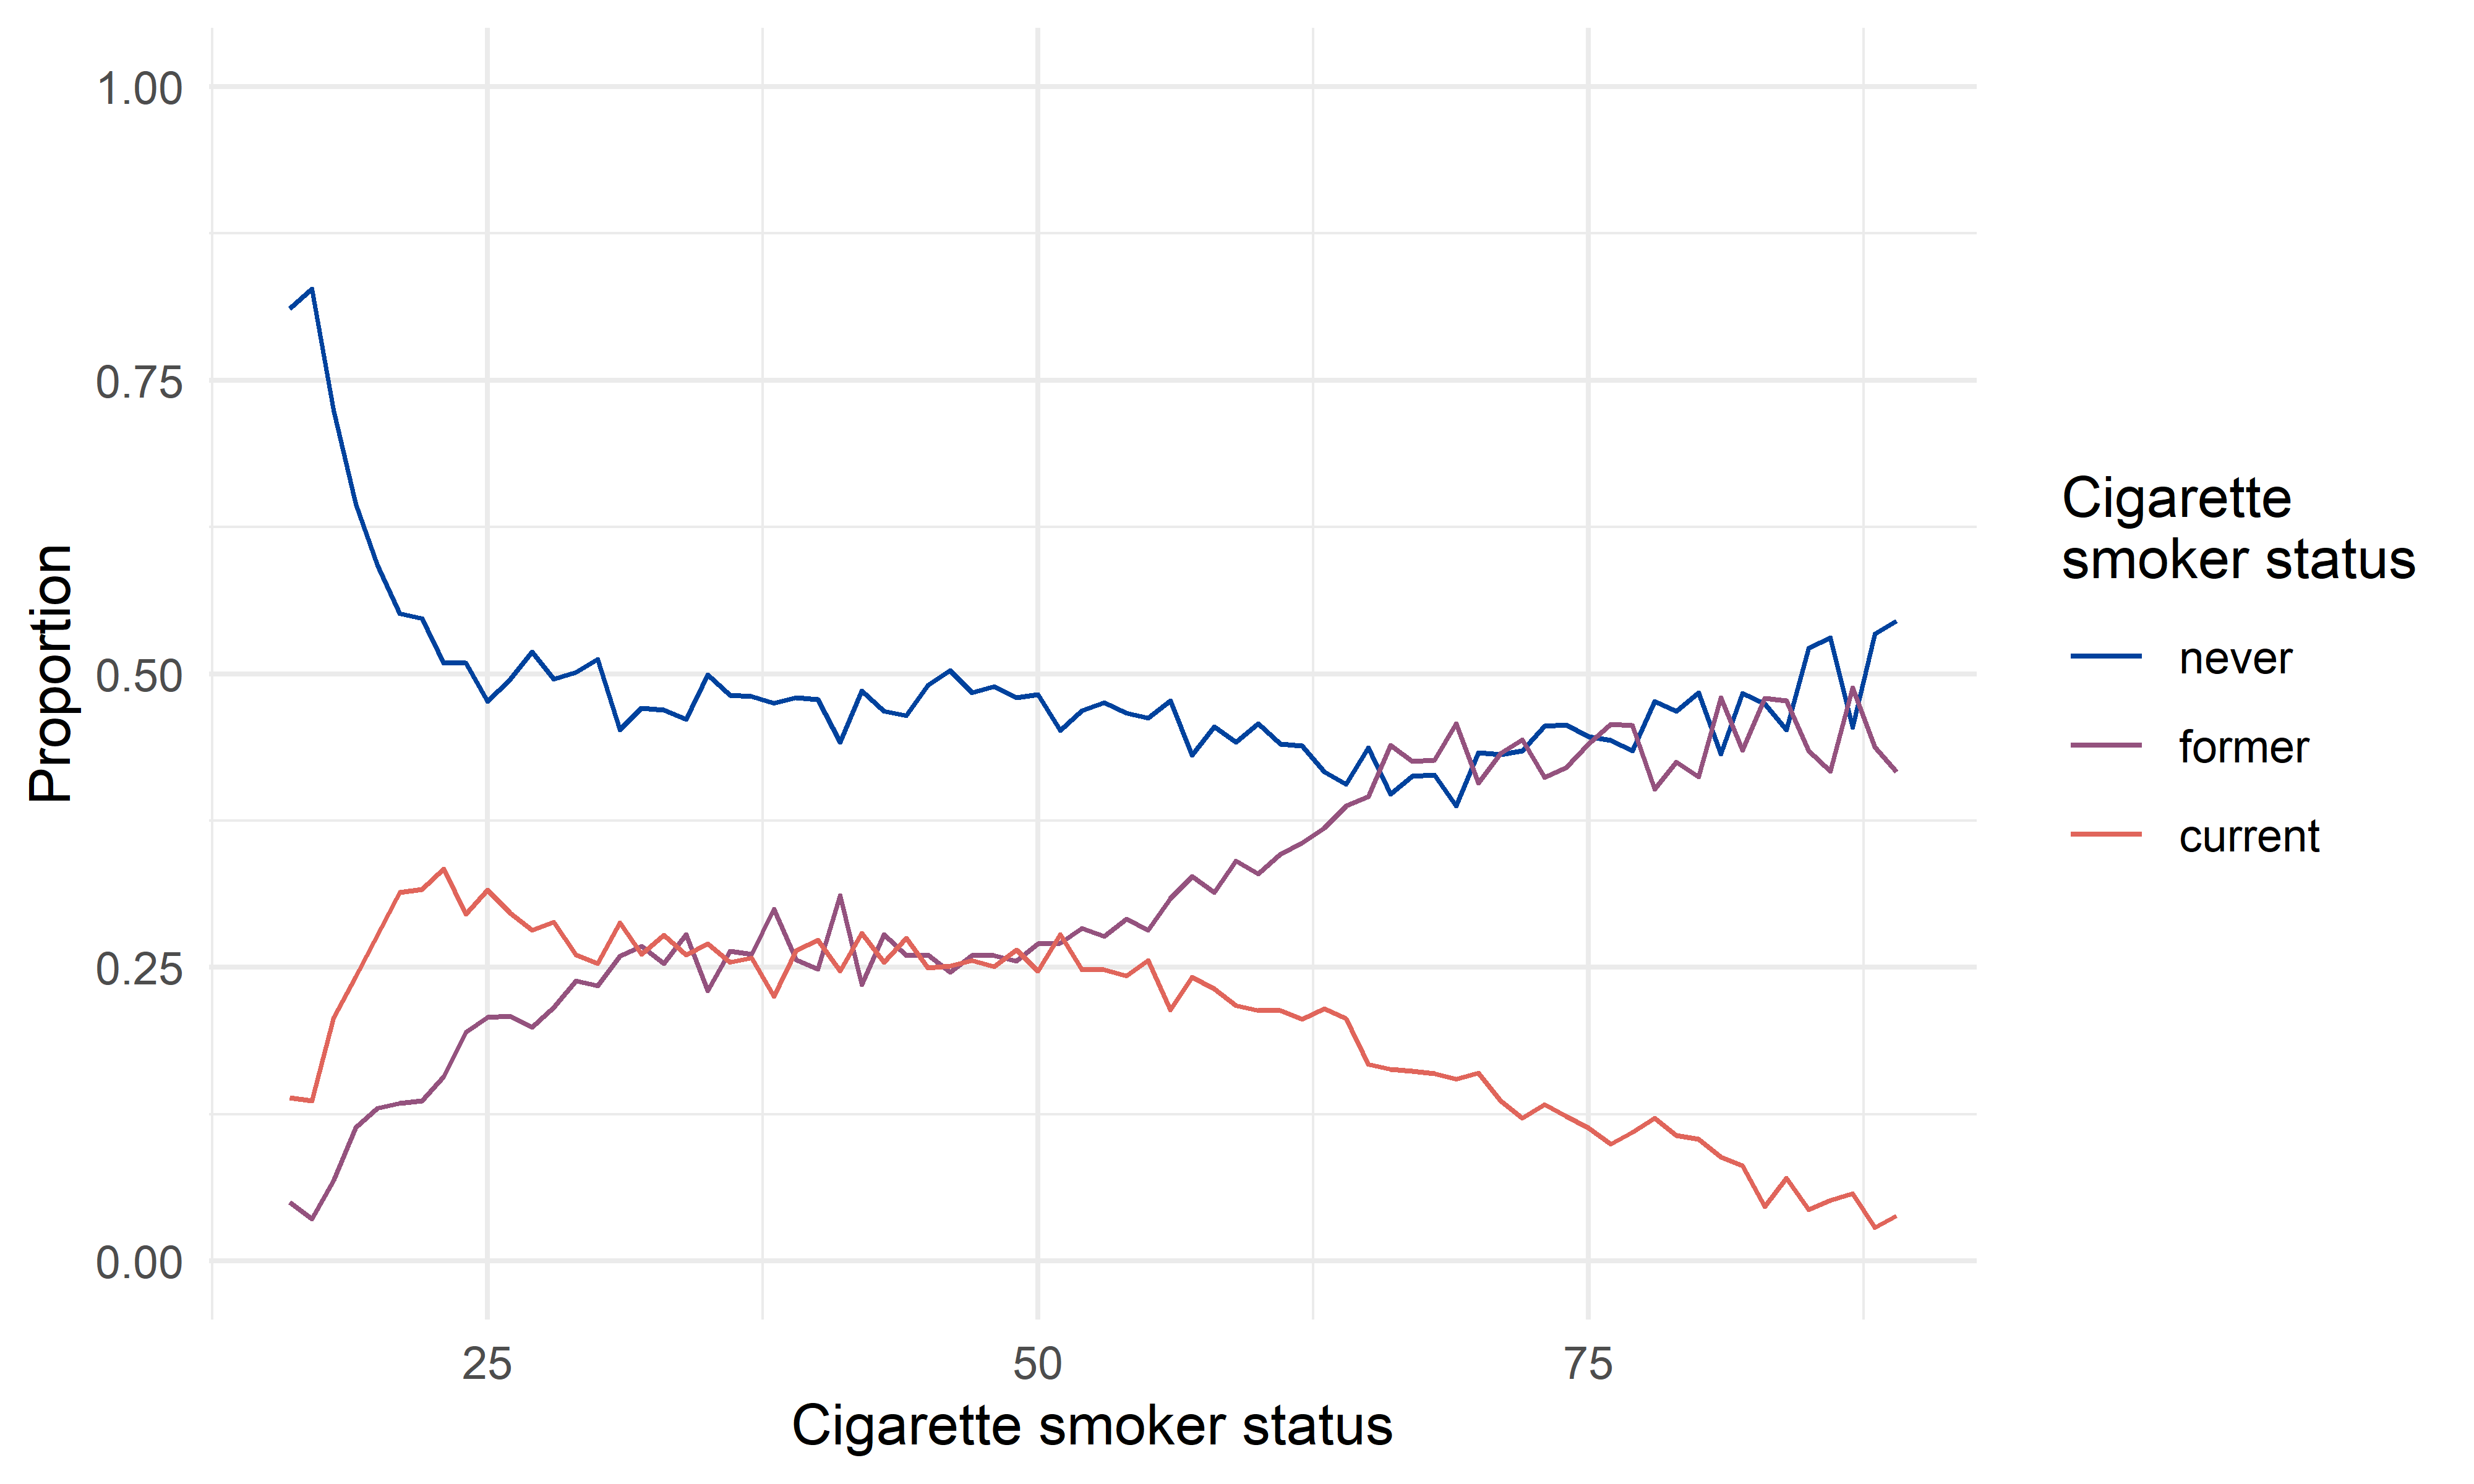
Figure 5. Age specific distribution of the population by cigarette smoker status.
Distribution of the age started smoking
The minimum possible age of starting to smoke is set at age 8 years.
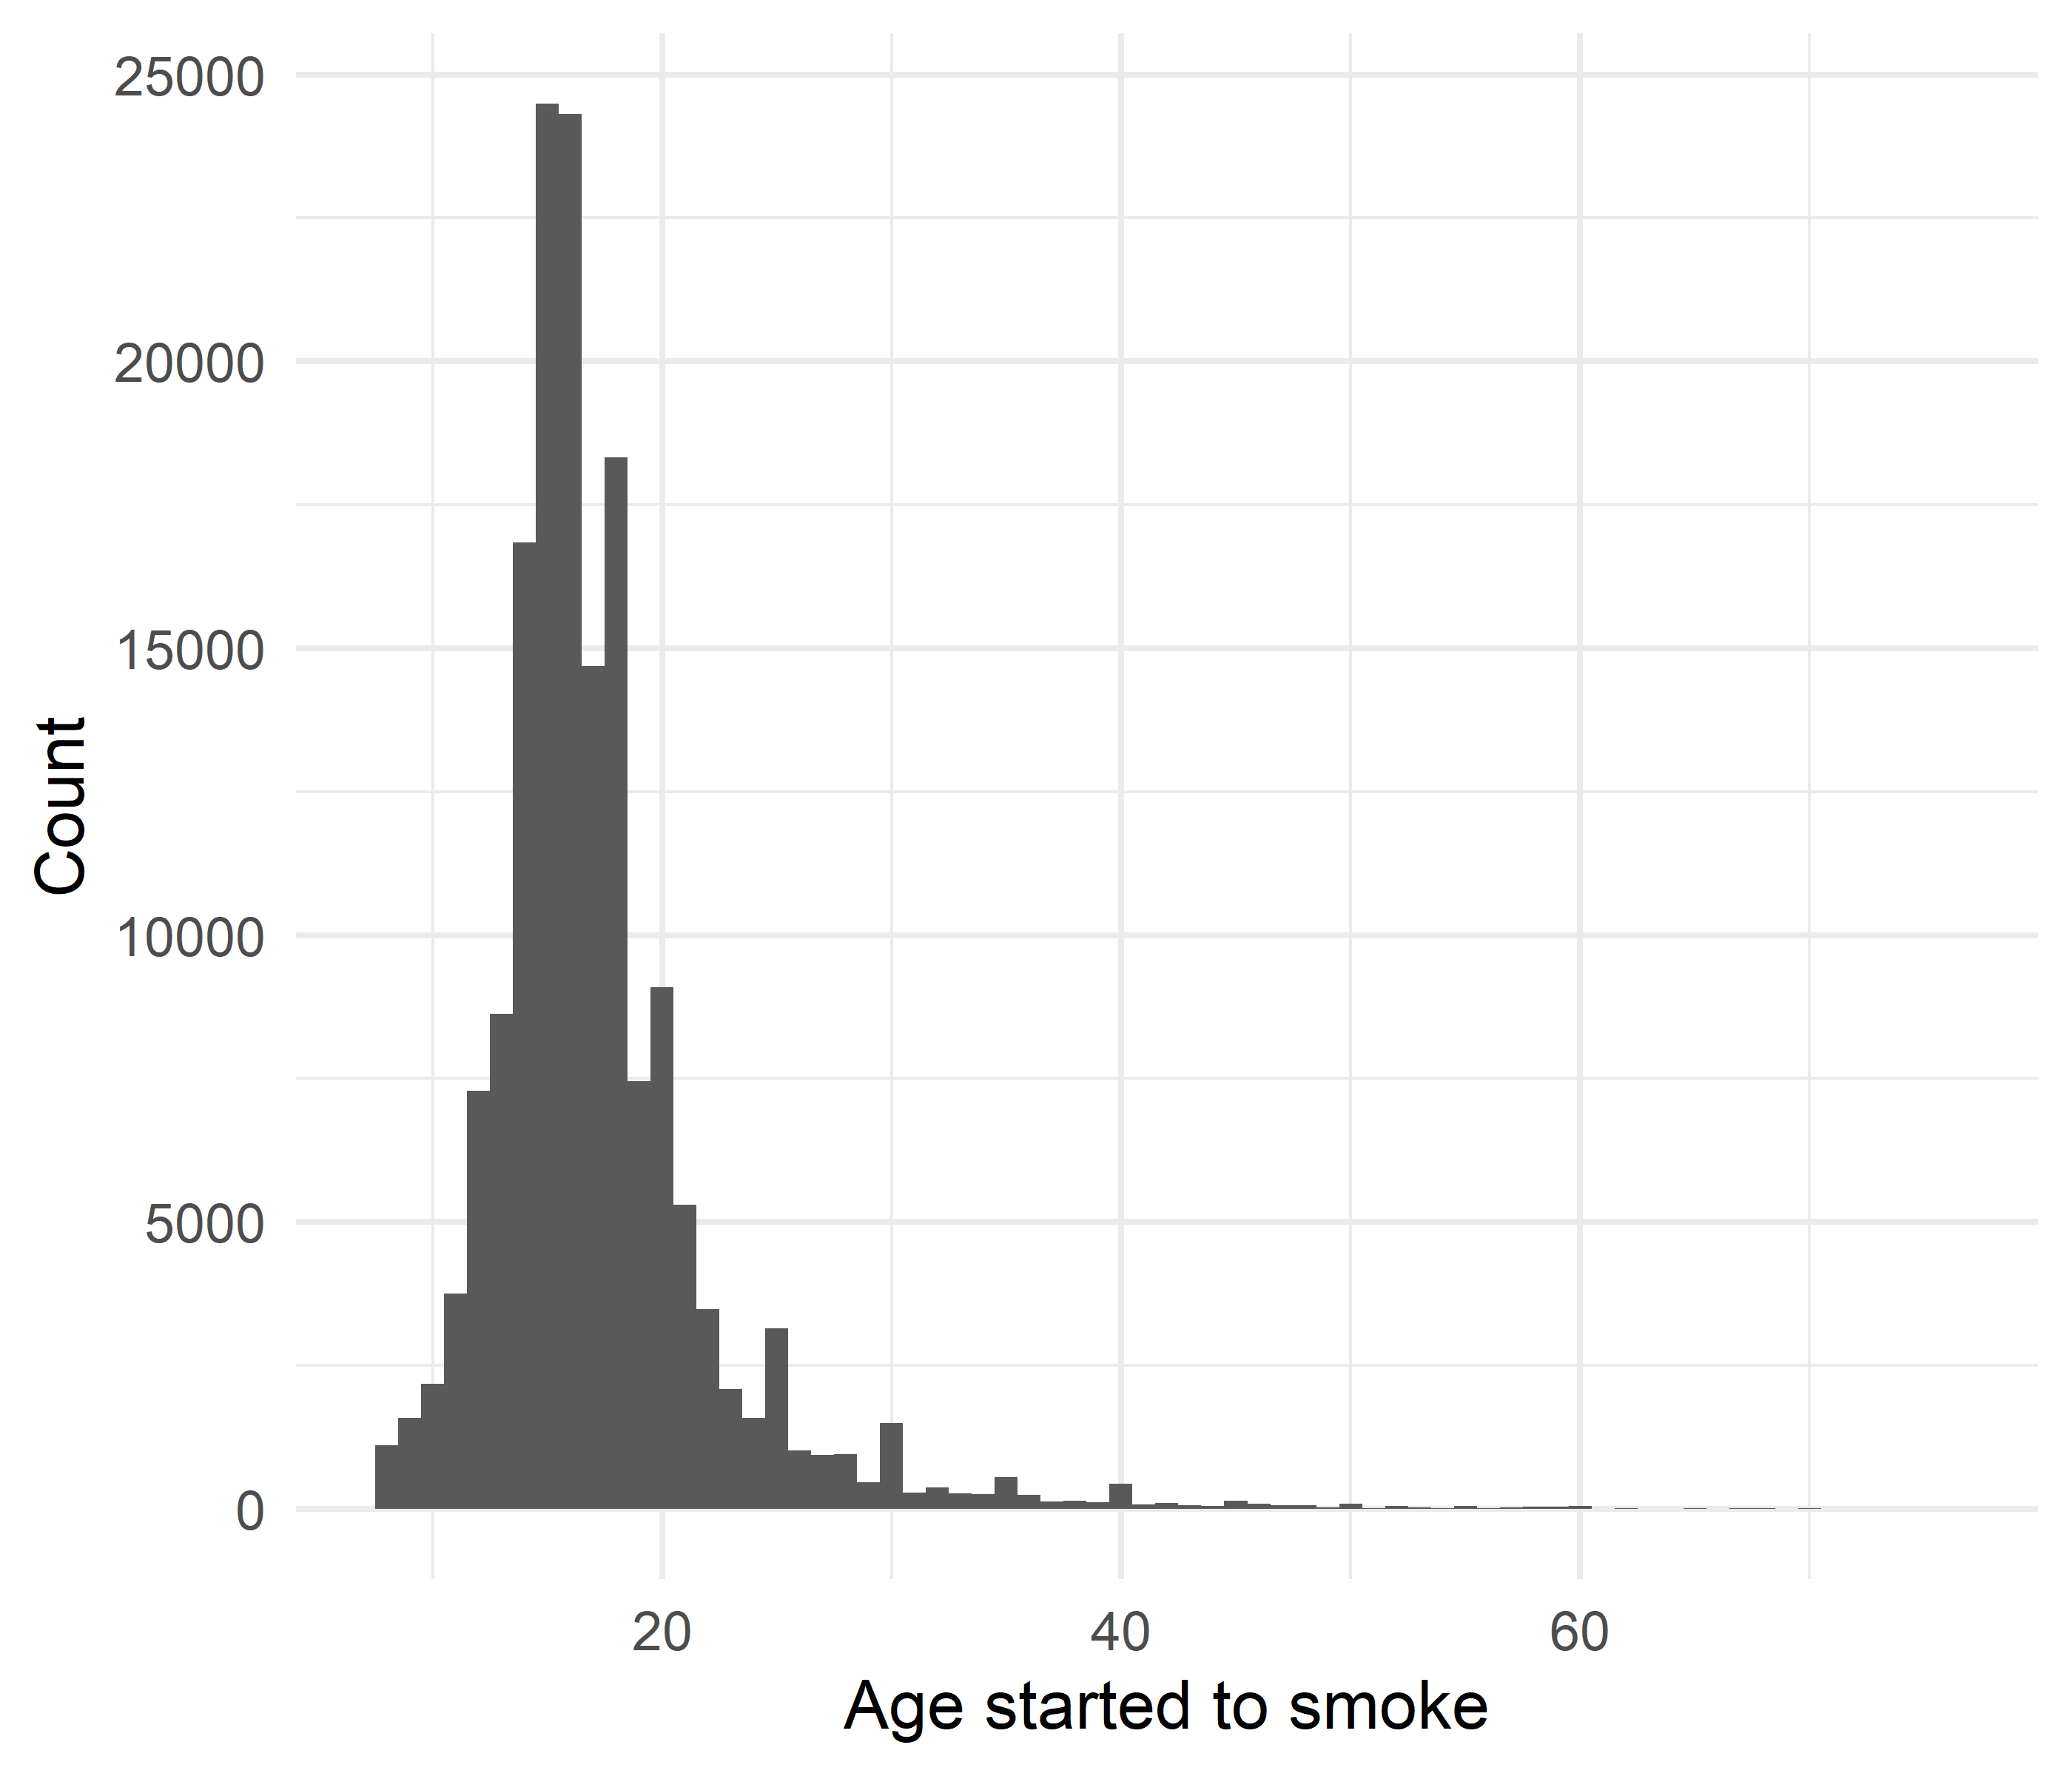
Figure 6. Age at starting to smoke.
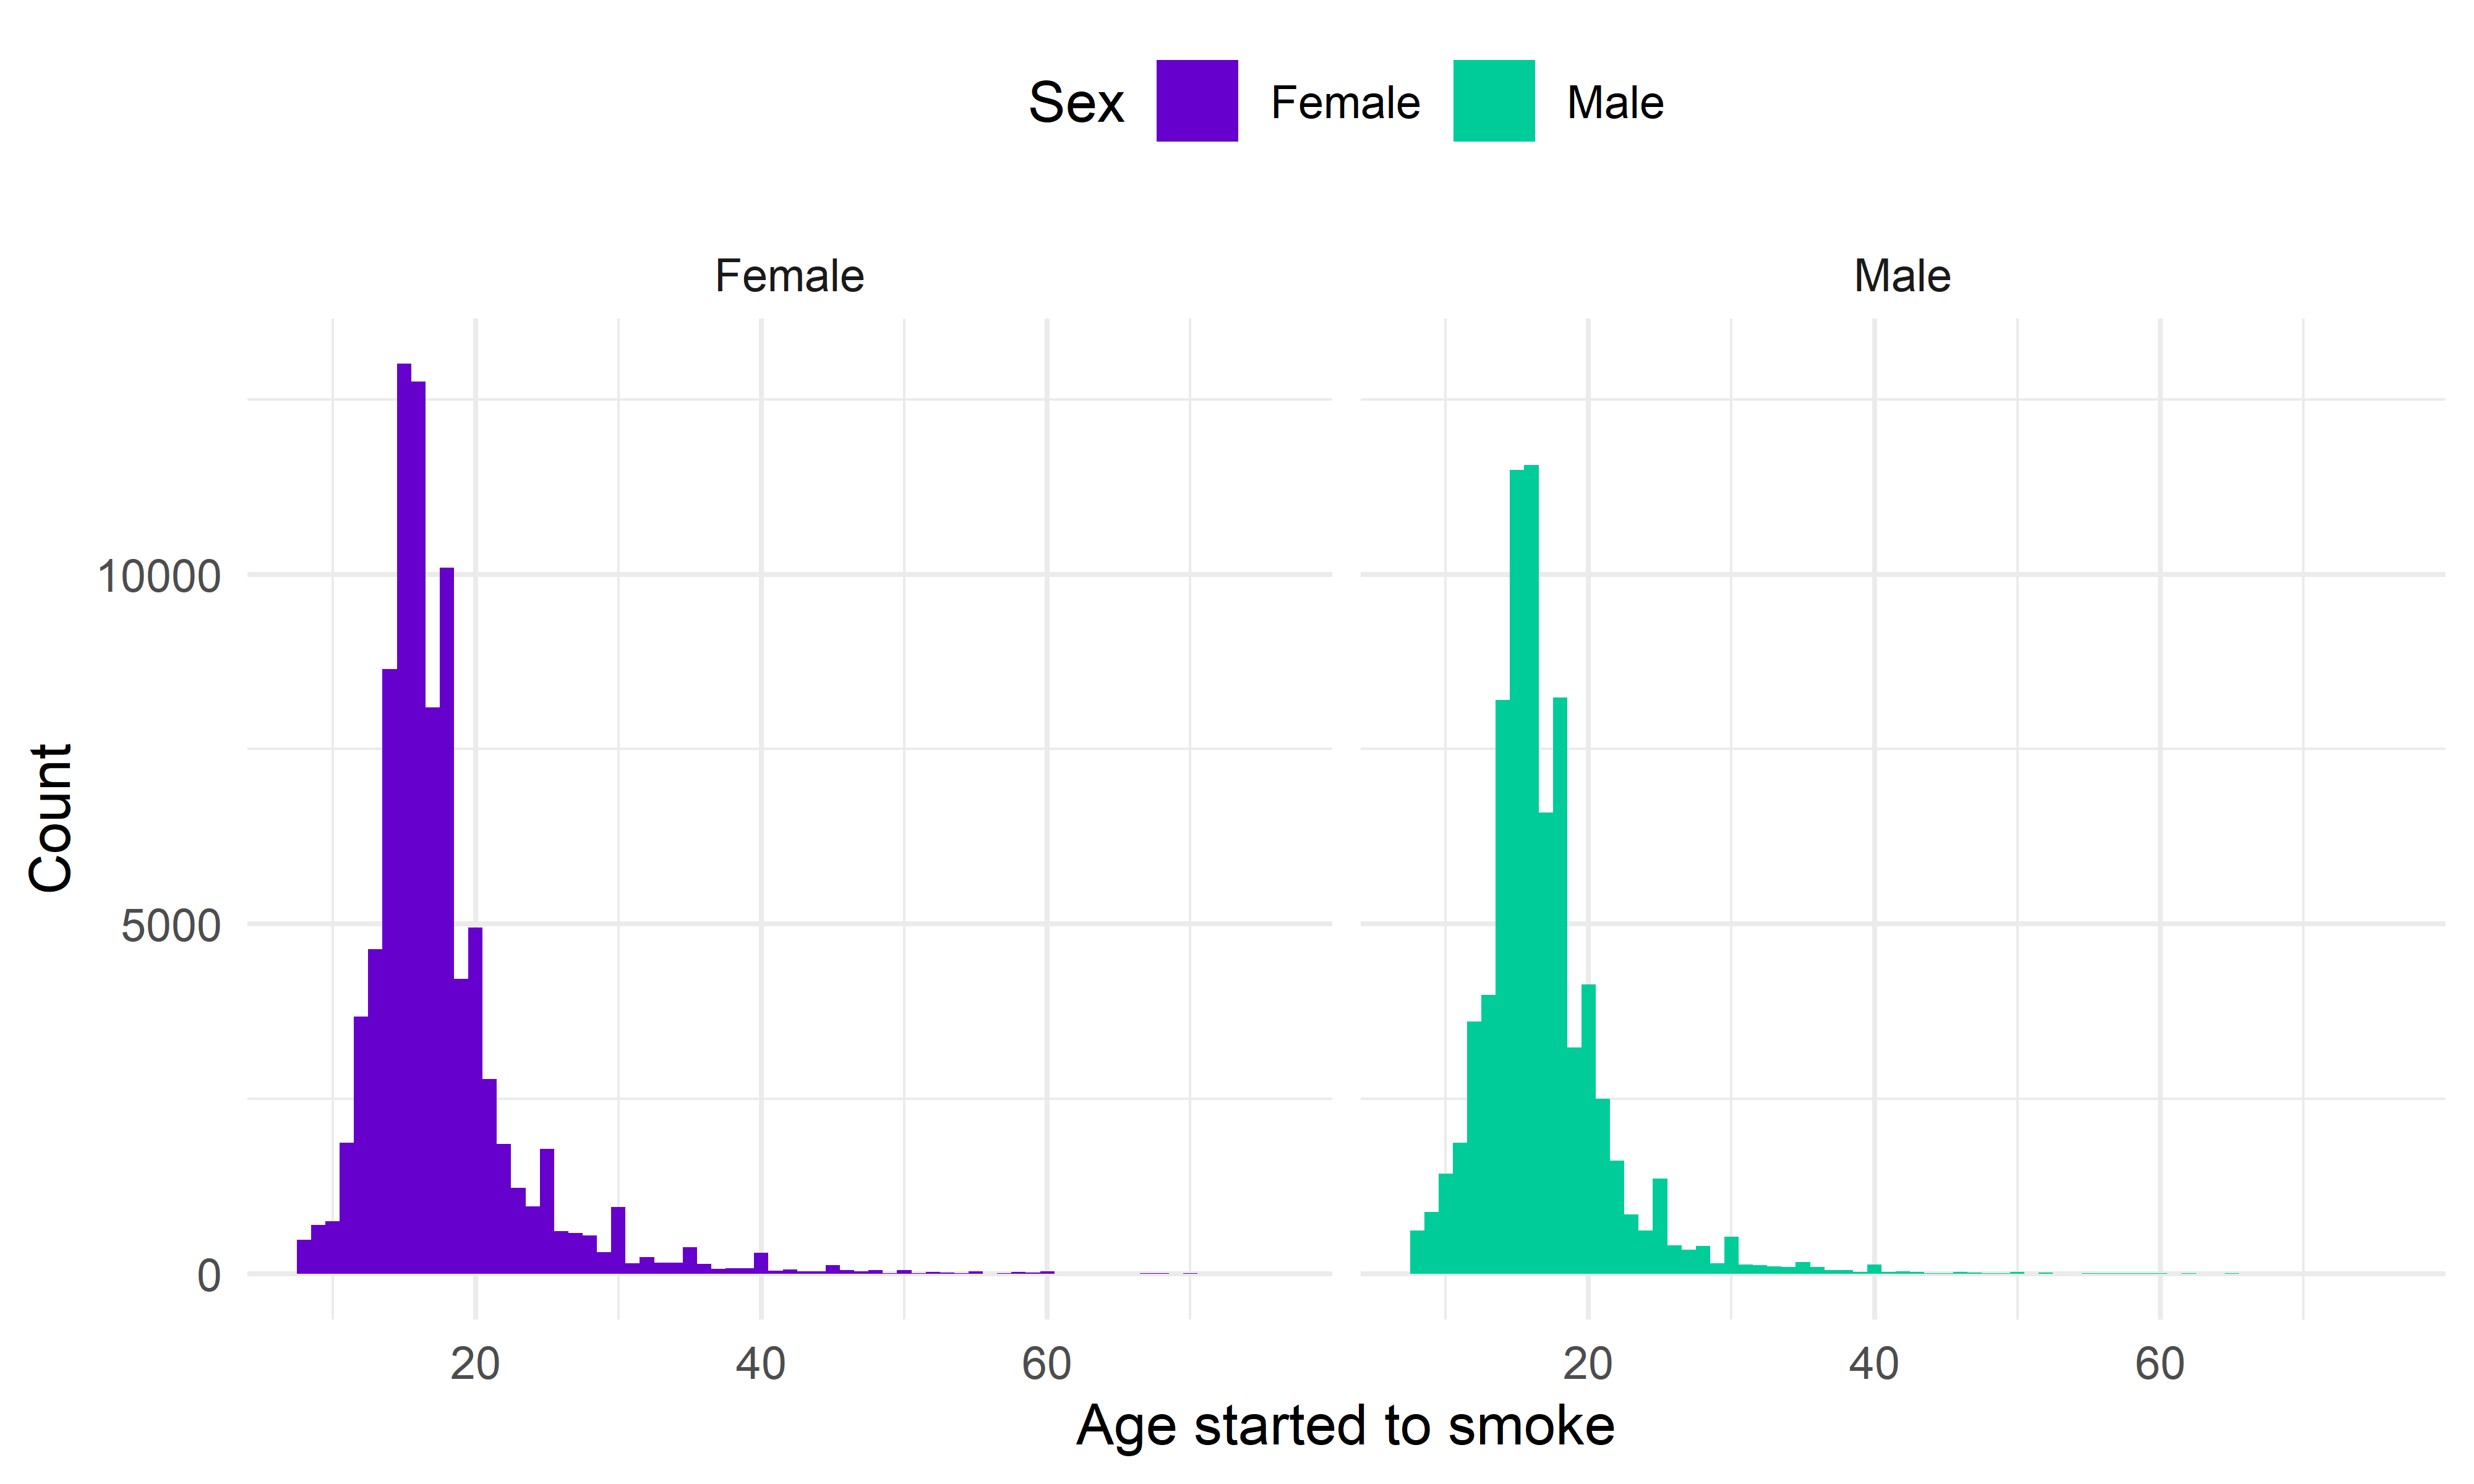
Figure 7. Sex specific age at starting to smoke.
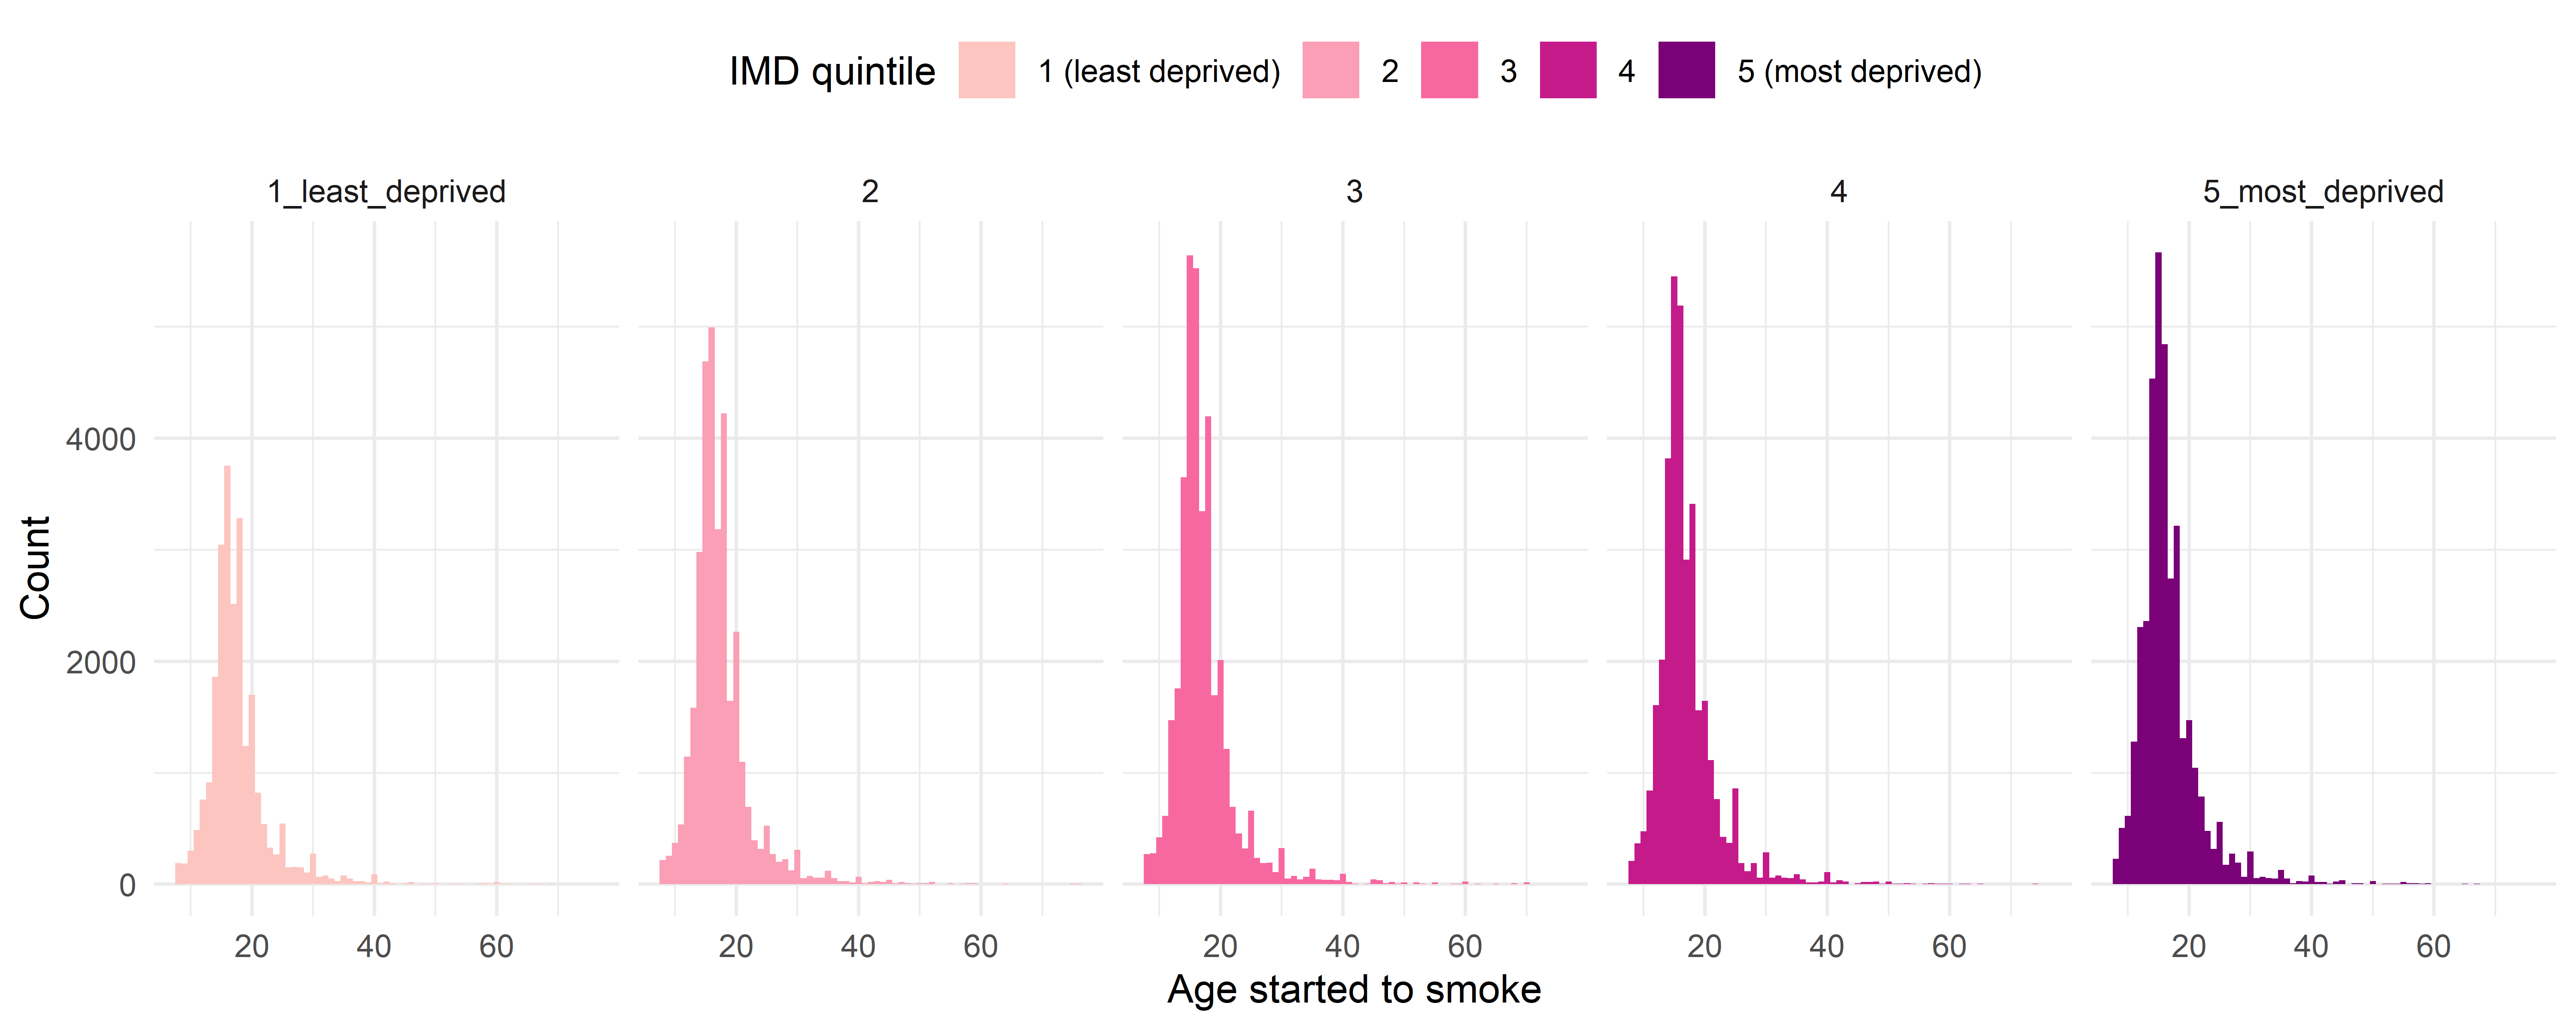
Figure 8. Index of Multiple Deprivation quintile specific age at starting to smoke.
Distribution of the average number of cigarettes smoked per day
The maximum possible number of cigarettes smoked per day is set at 60.
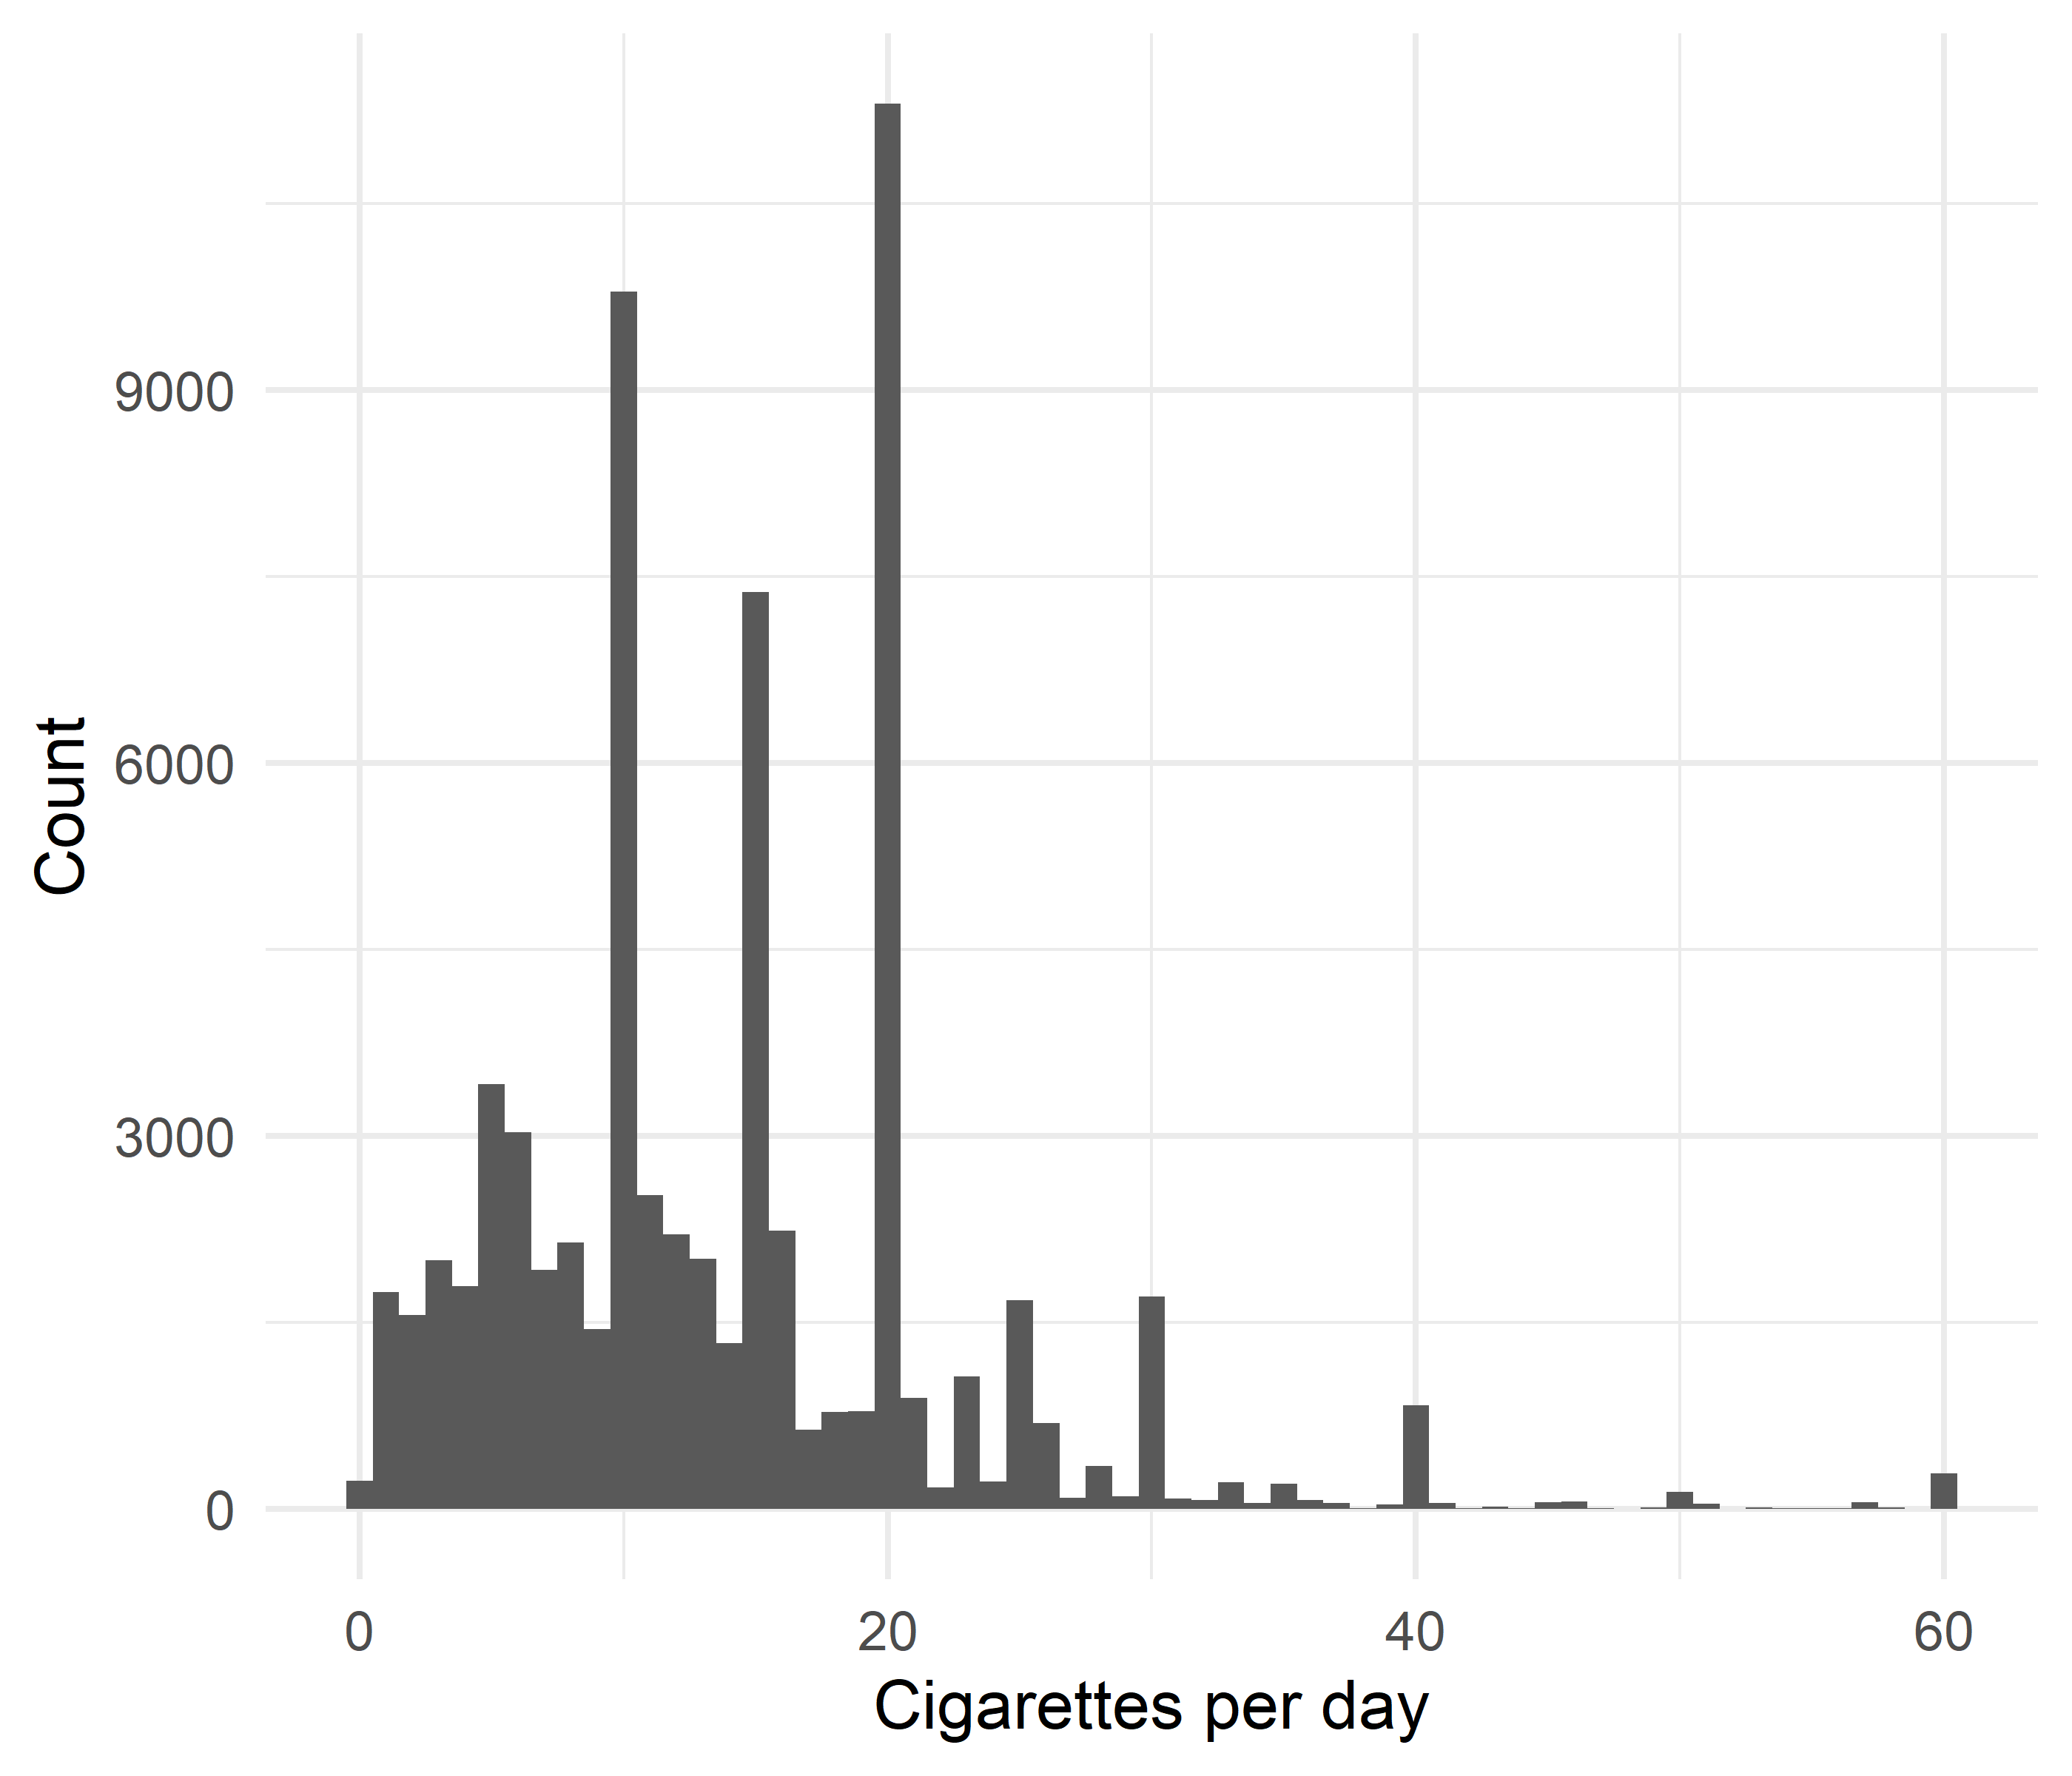
Figure 9. Distribution of the average number of cigarettes smoked per day by current smokers.
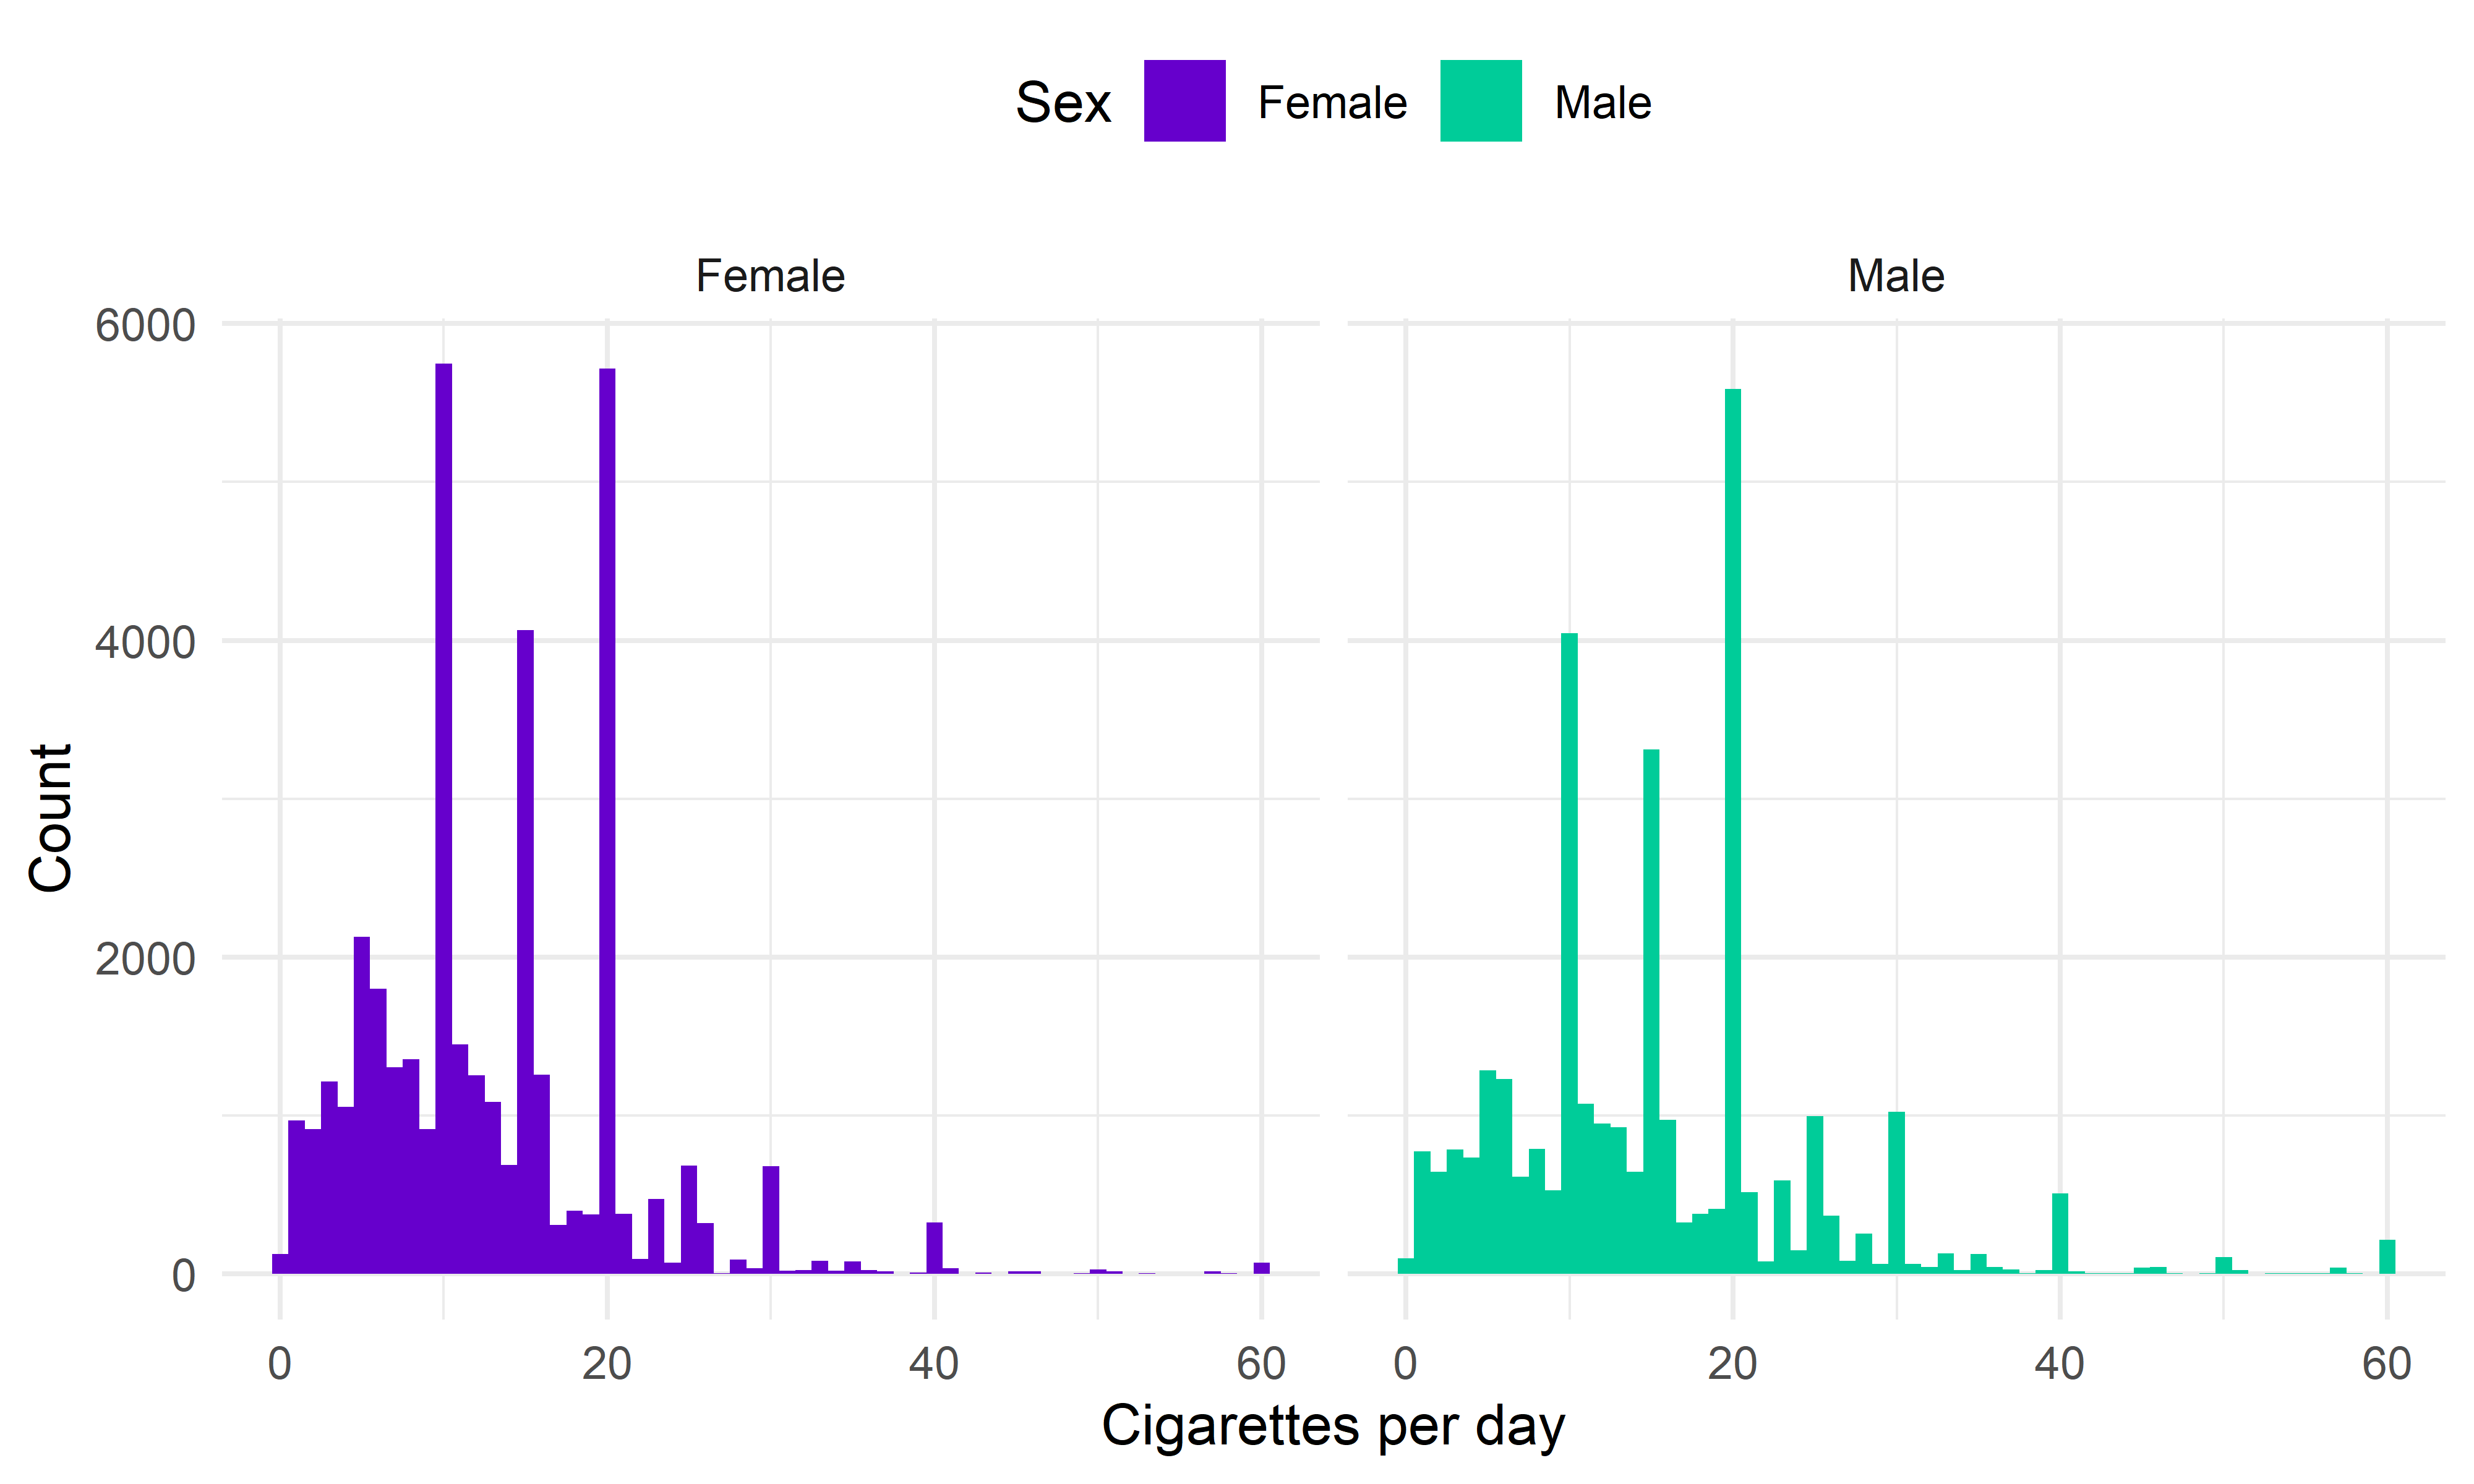
Figure 10. Sex specific distribution of the average number of cigarettes smoked per day by current smokers.
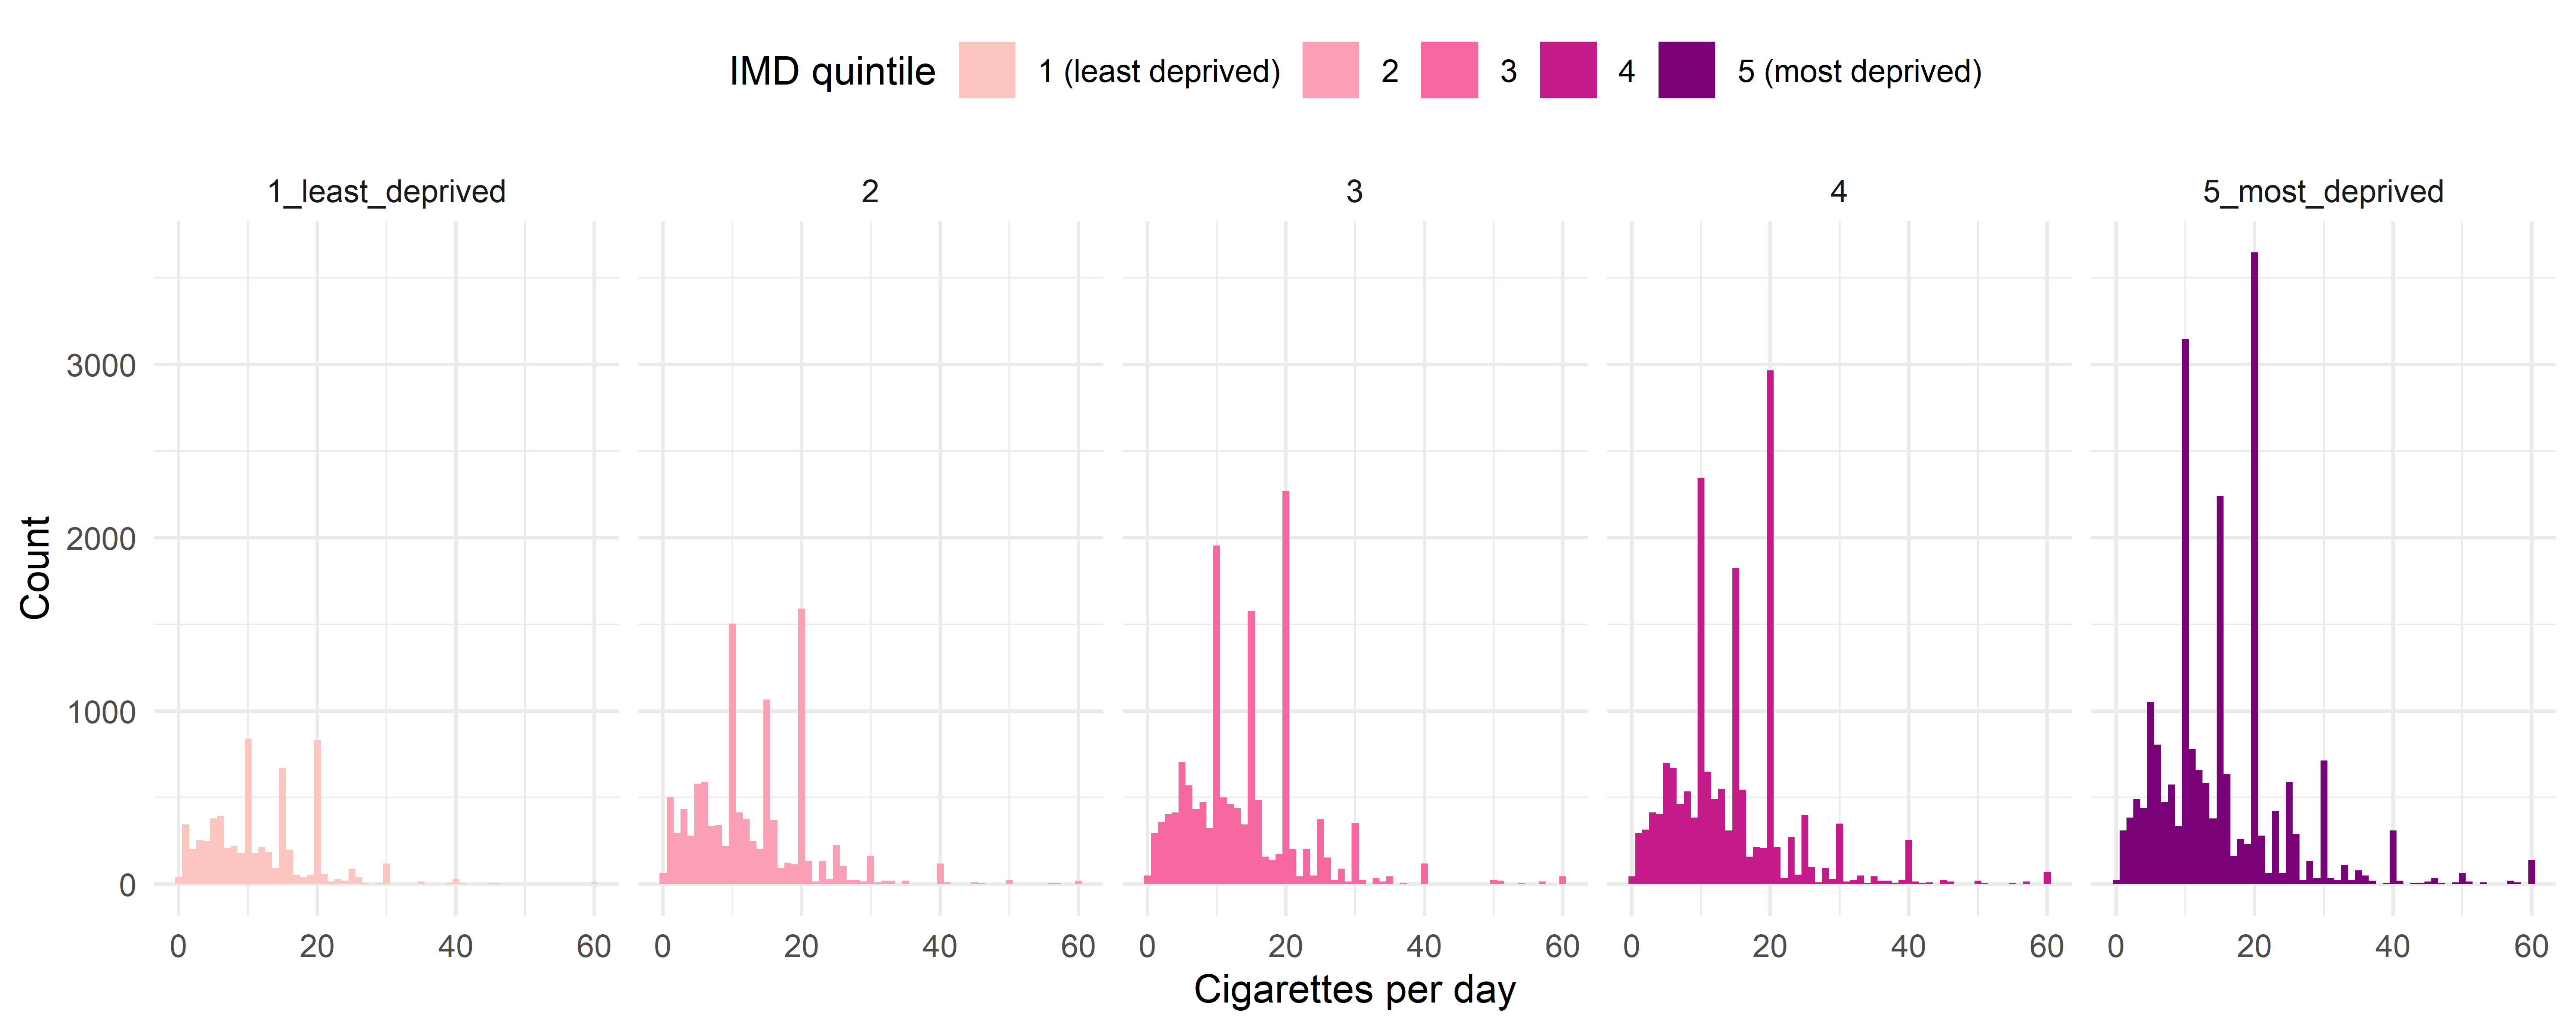
Figure 11. Index of Multiple Deprivation quintile specific distribution of the average number of cigarettes smoked per day by current smokers.
Distribution of the number of years since quitting smoking
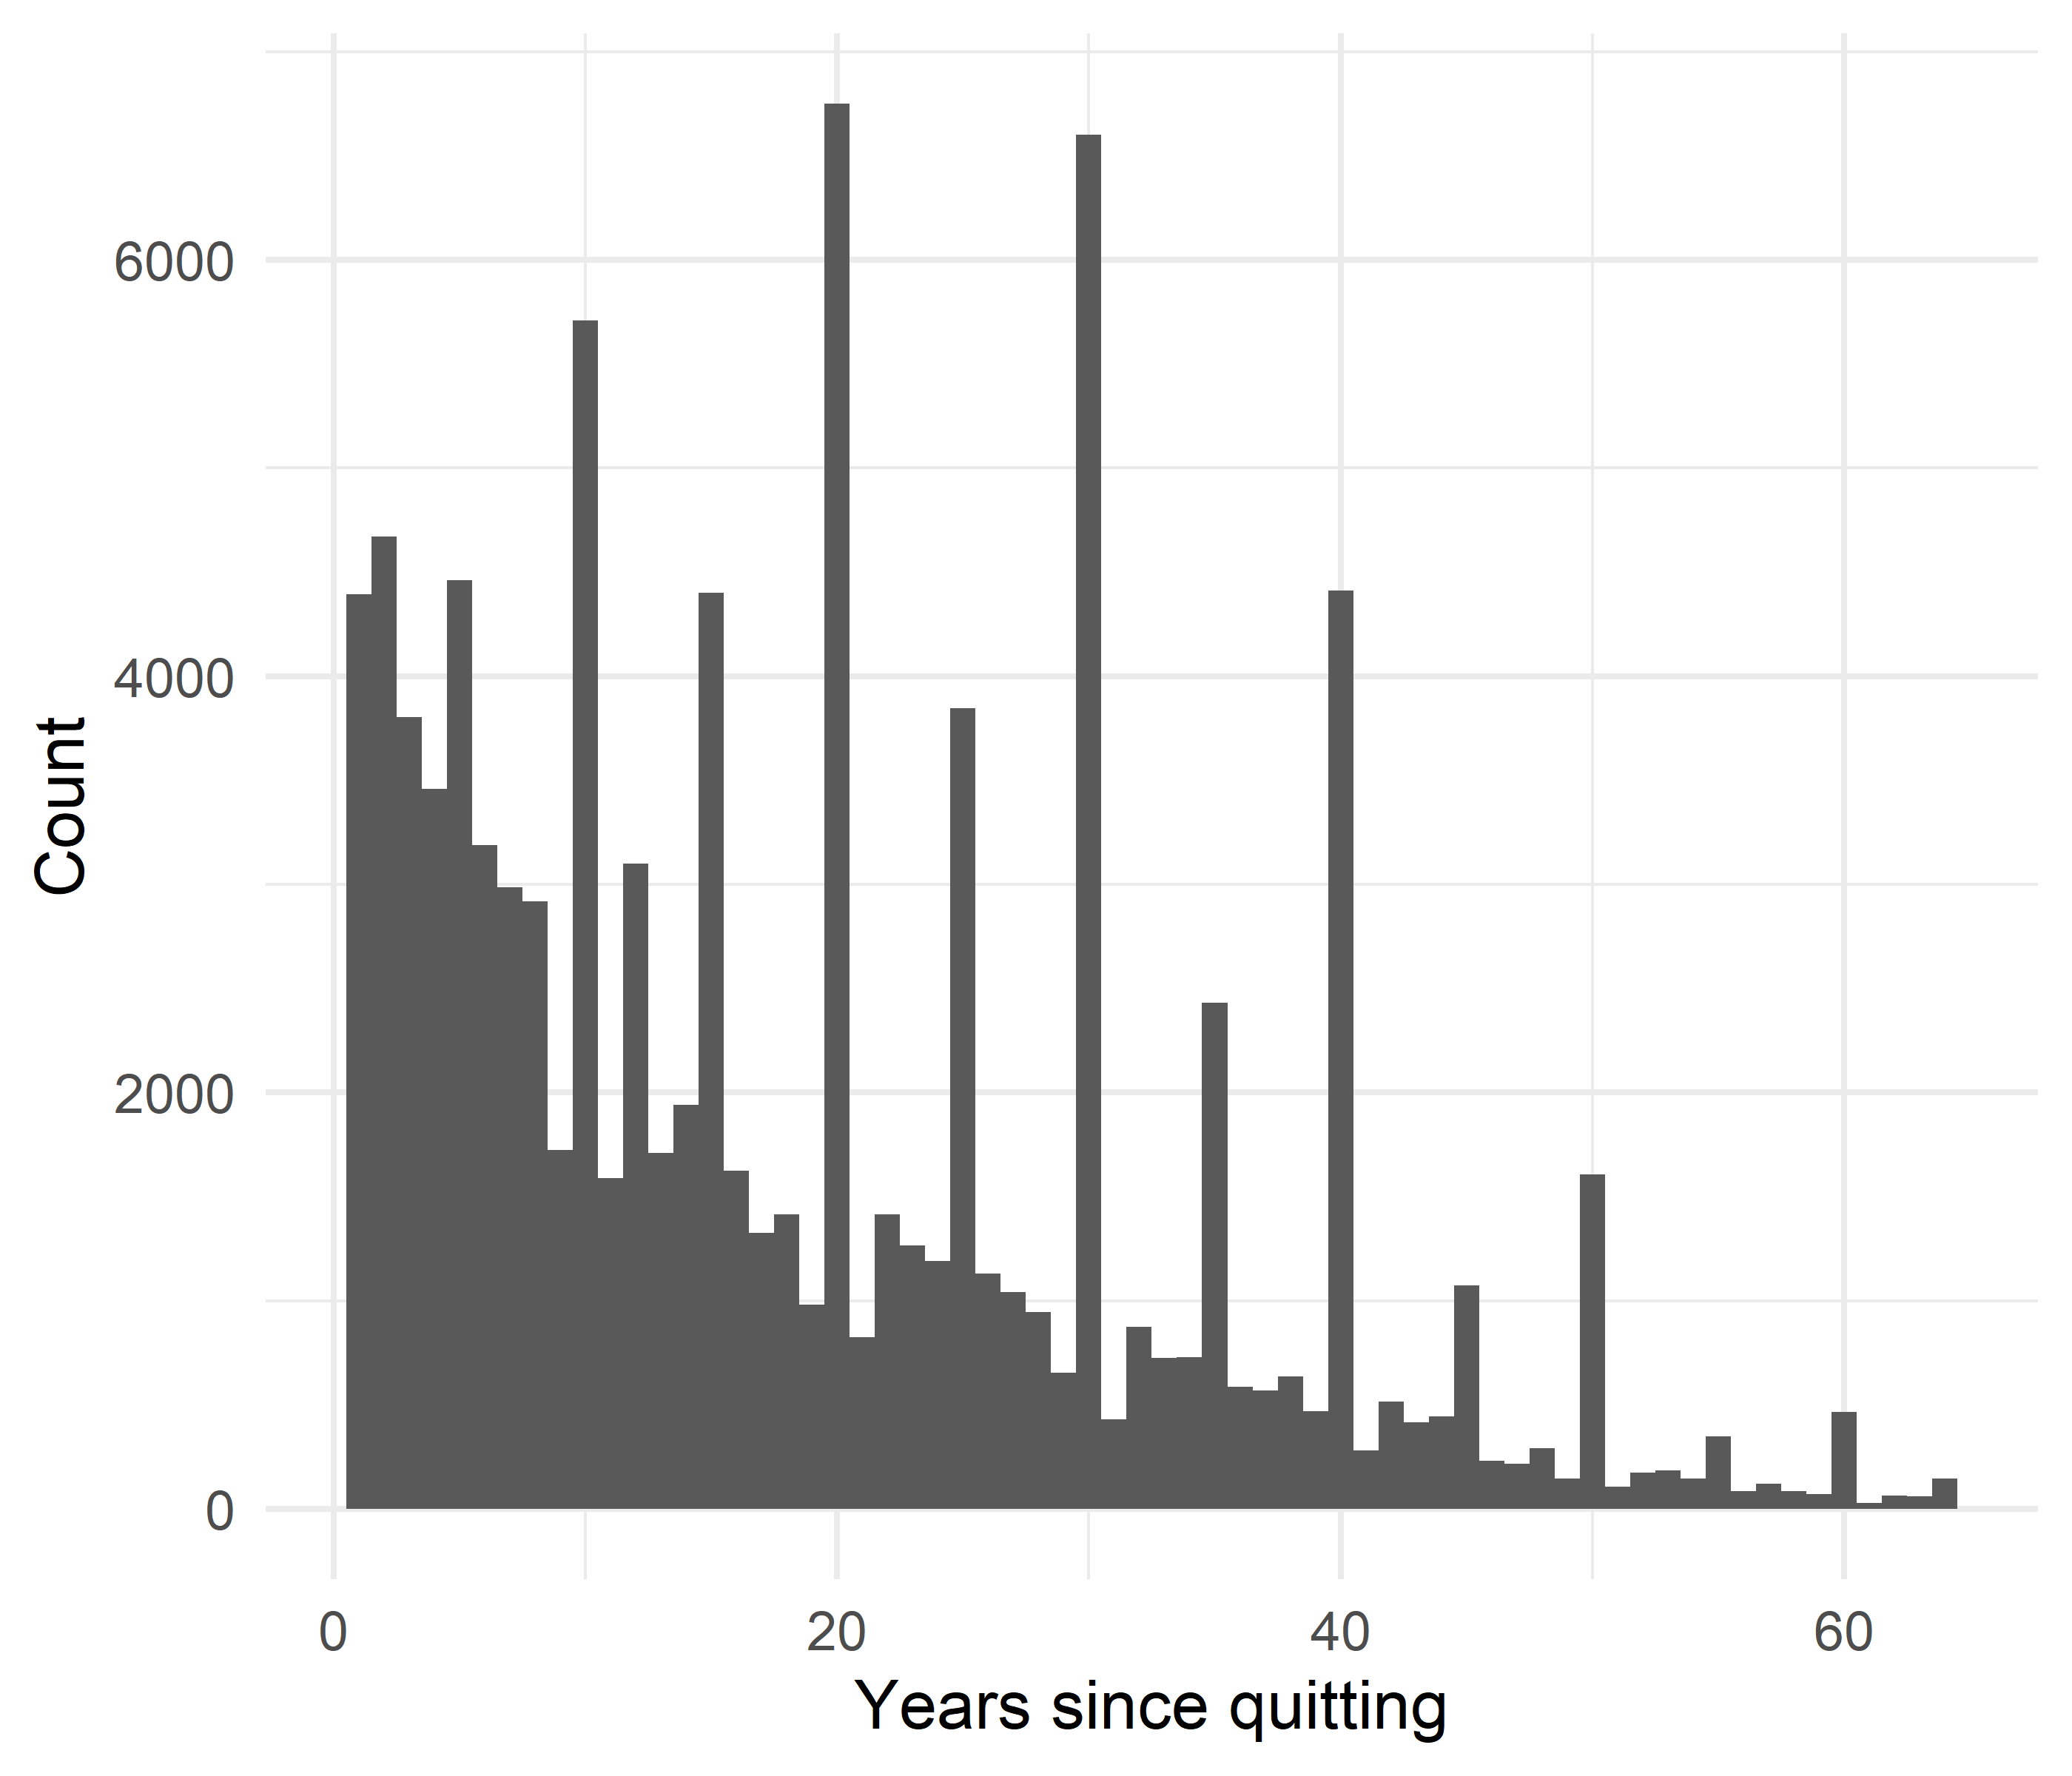
Figure 12. Distribution of the number of years since quitting in former smokers.
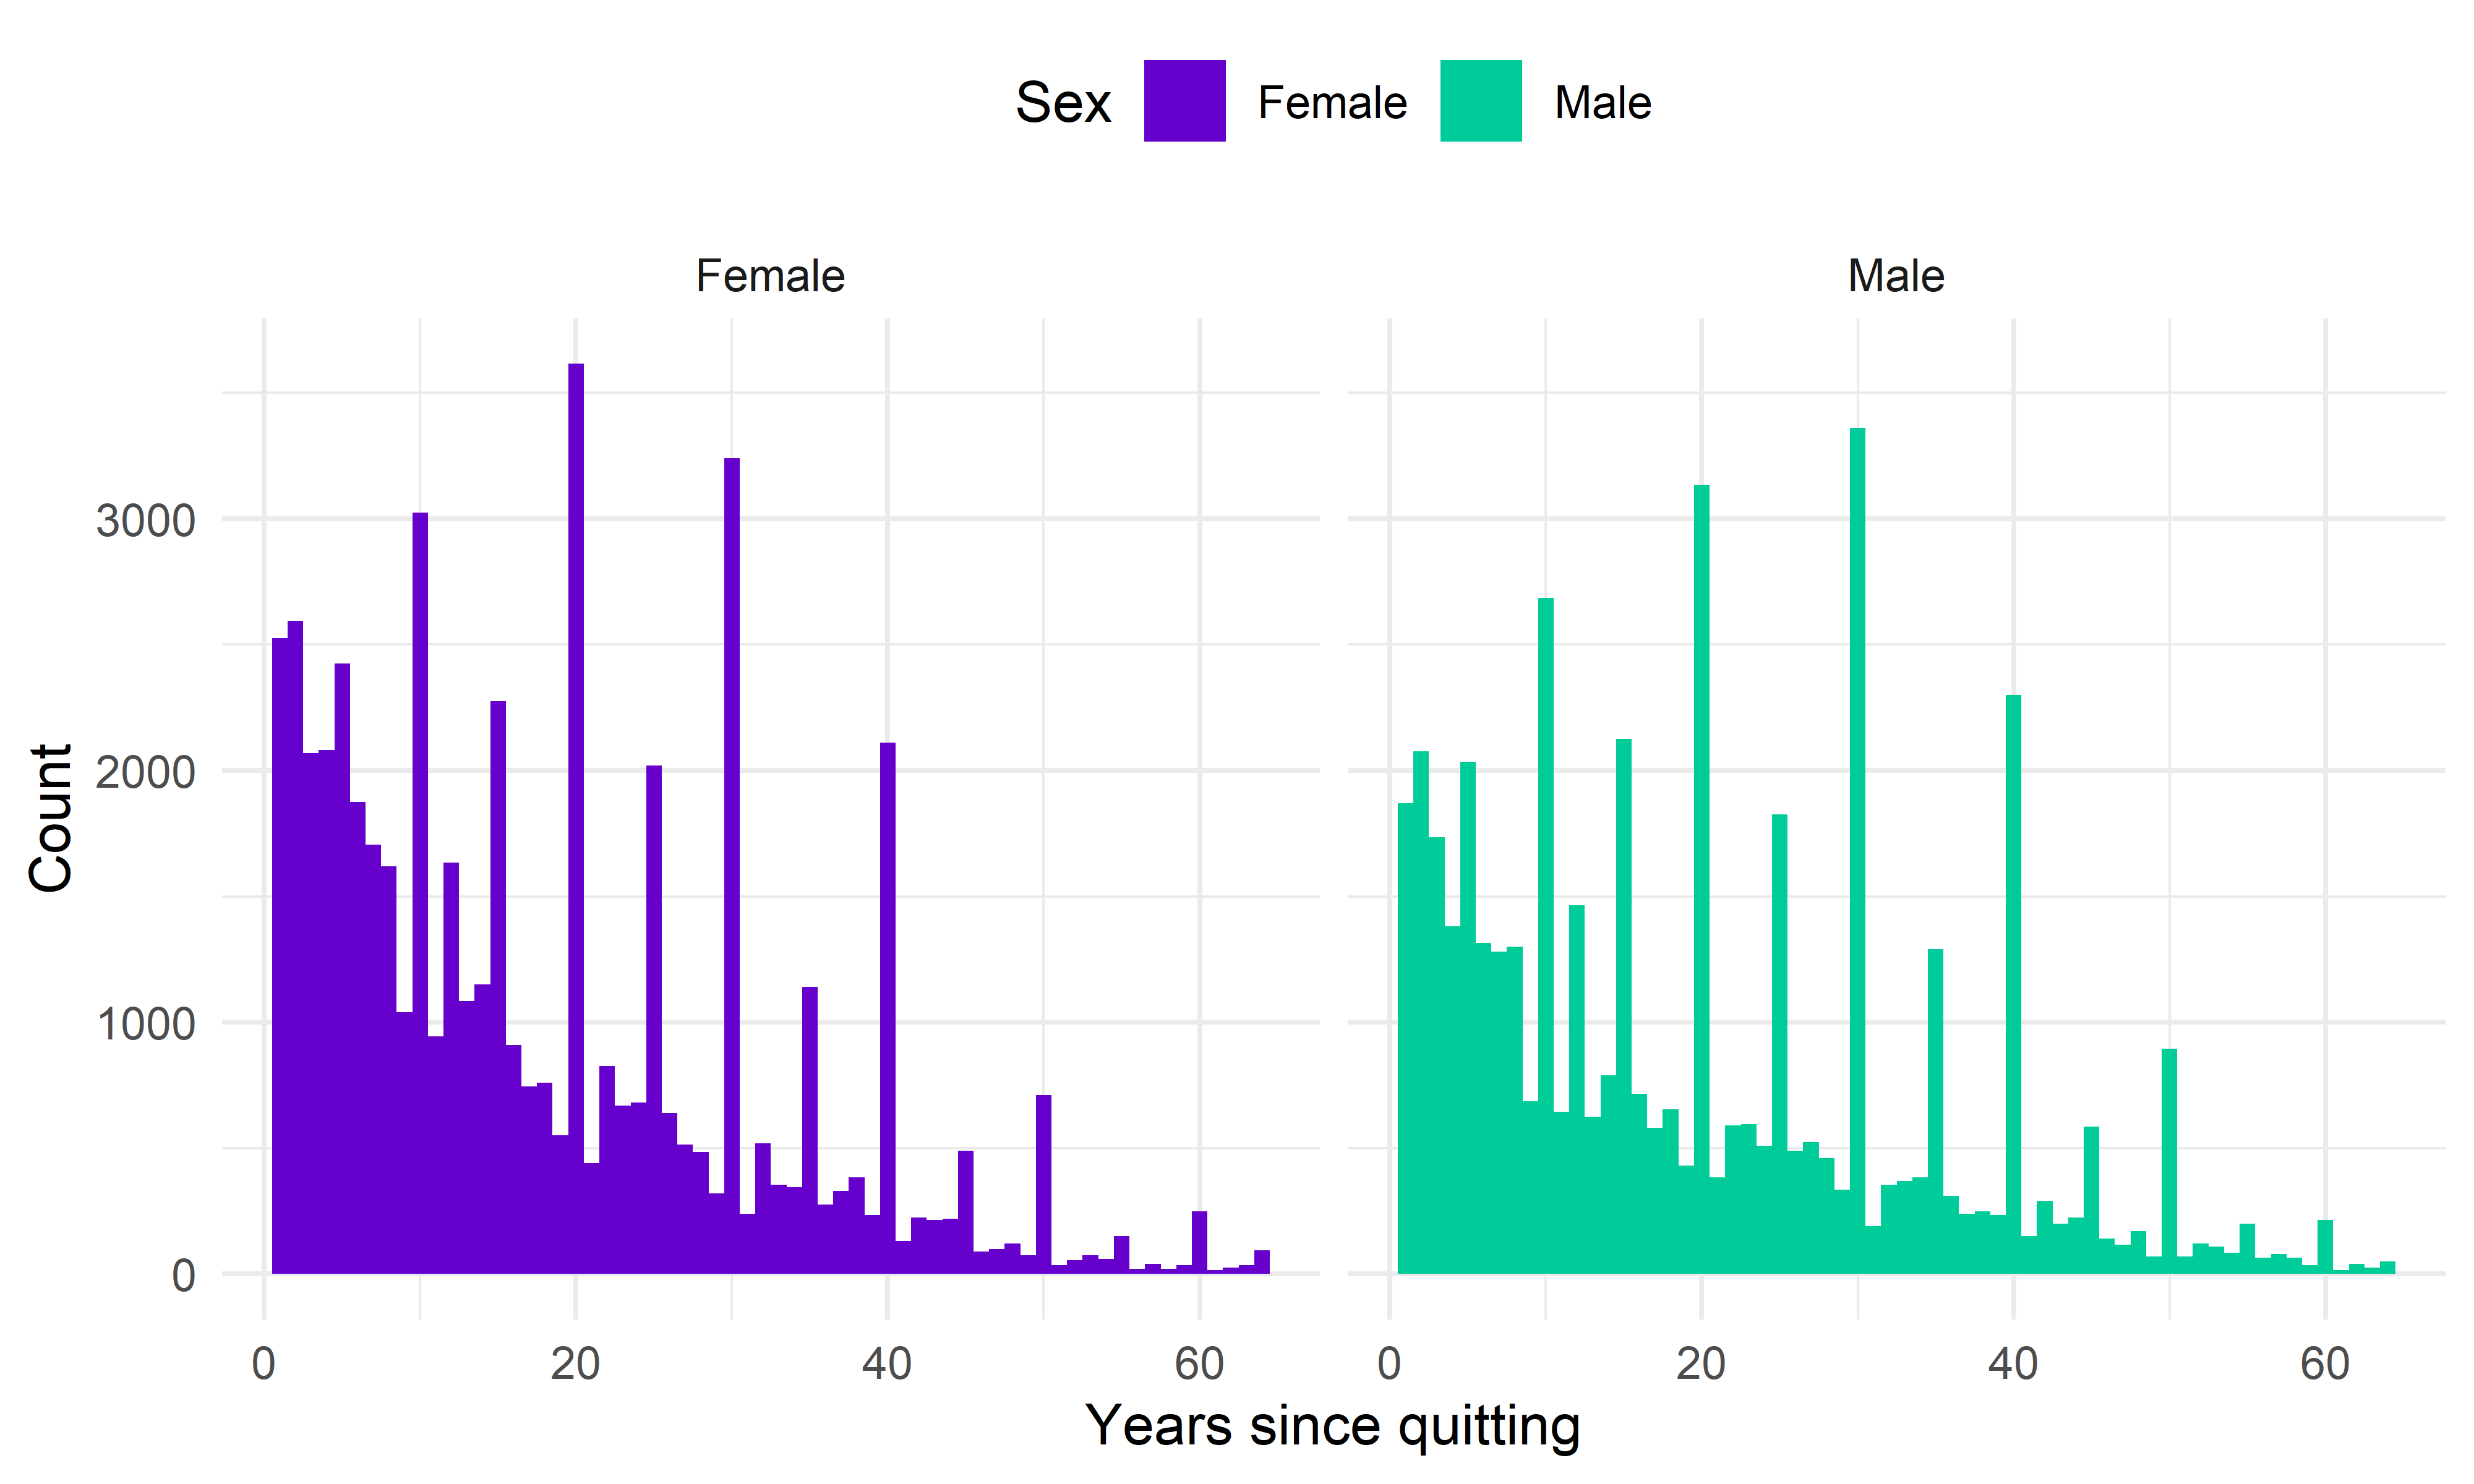
Figure 13. Sex specific distribution of the number of years since quitting in former smokers.
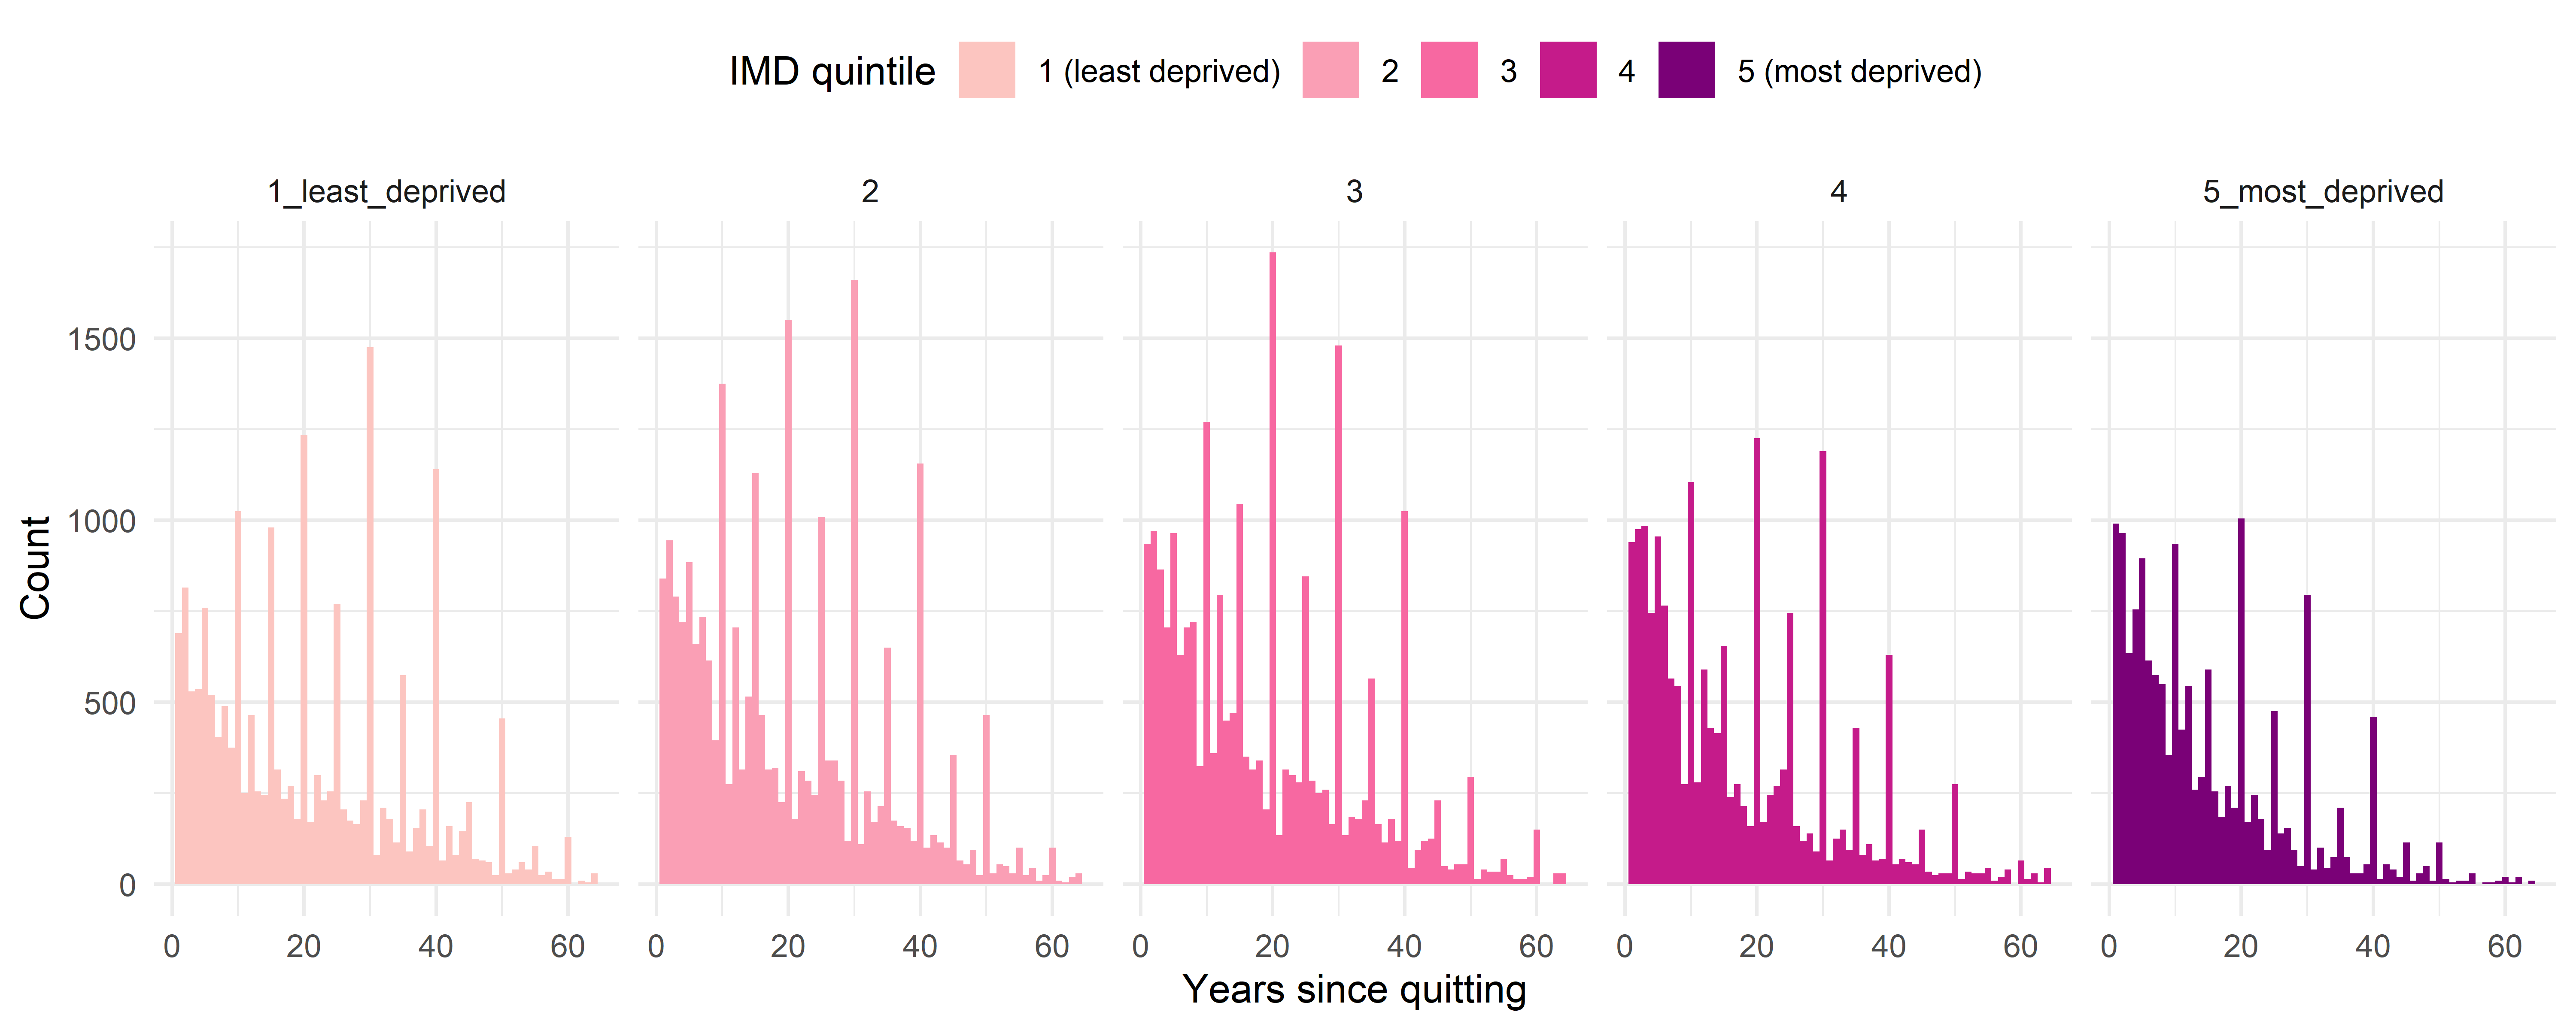
Figure 14. Index of Multiple Deprivation quintile specific distribution of the number of years since quitting in former smokers.
Reproducibility notes
- Data processed using hseclean version 1.11.3 (open access)
- Github code repository https://github.com/STAPM/hseclean. Code for these plots https://github.com/STAPM/hseclean/tree/master/vignettes/Scotland_tobacco_data
- Open Science Framework repository https://osf.io/43n7p/