Data check: Upshifted alcohol consumption for Scotland
Scotland_alcohol_upshifting_report.RmdClick here to go to the Scottish Health Survey data page on the STAPM website
The purpose of this document
To plot the data processed using the upshift function in the hseclean package as part of the process of quality assurance of the preparation of input data used in the alcohol component of the STAPM modelling for Scotland. This document comprises exploratory plots to illustrate the Scottish Health Survey data on alcohol consumption before and after upshifting is applied.
Background
The Scottish Health Survey (SHeS) asks respondents about the volume of certain types of drinks bought or consumed over a certain time period. It is the source of data on alcohol consumption used to inform the alcohol component of the Sheffield Tobacco and Alcohol Policy Modelling. The consumption data is then converted into an estimate of the average weekly alcohol consumption using functions in the hseclean R package. For more information on alcohol consumption in the Scottish Health Survey and the assumptions made by the hseclean method, please see Data check: Alcohol consumption in the Scottish Health Survey.
It is generally accepted that this self-reported data underestimates actual consumption by as much as 50% (Stockwell et al. 2004). This data check does not investigate the magnitude of such underestimation or the potential biases introduced.
To adjust for the under-reporting of alcohol consumption in survey data, the average weekly consumption of alcohol provided by the SHeS data can be upshifted to a proportion of a reference value for alcohol consumption. For Scotland, between the years 2008 and 2019, the reference data used is the per capita sales of alcohol from the Monitoring and Evaluating Scotland’s Alcohol Strategy (MESAS) monitoring report 2022. The default proportion used is 80%, as it has been recommended that alcohol consumption data from surveys should be upshifted to 80% of official population consumption based on sales or taxation data to give better estimates of the burden of alcohol-related disease (Stockwell et al. 2018).
Data checks conducted
Data checks are conducted on years 2015 to 2019 of the SHeS data.
Distribution of average weekly alcohol consumption before and after upshifting is applied
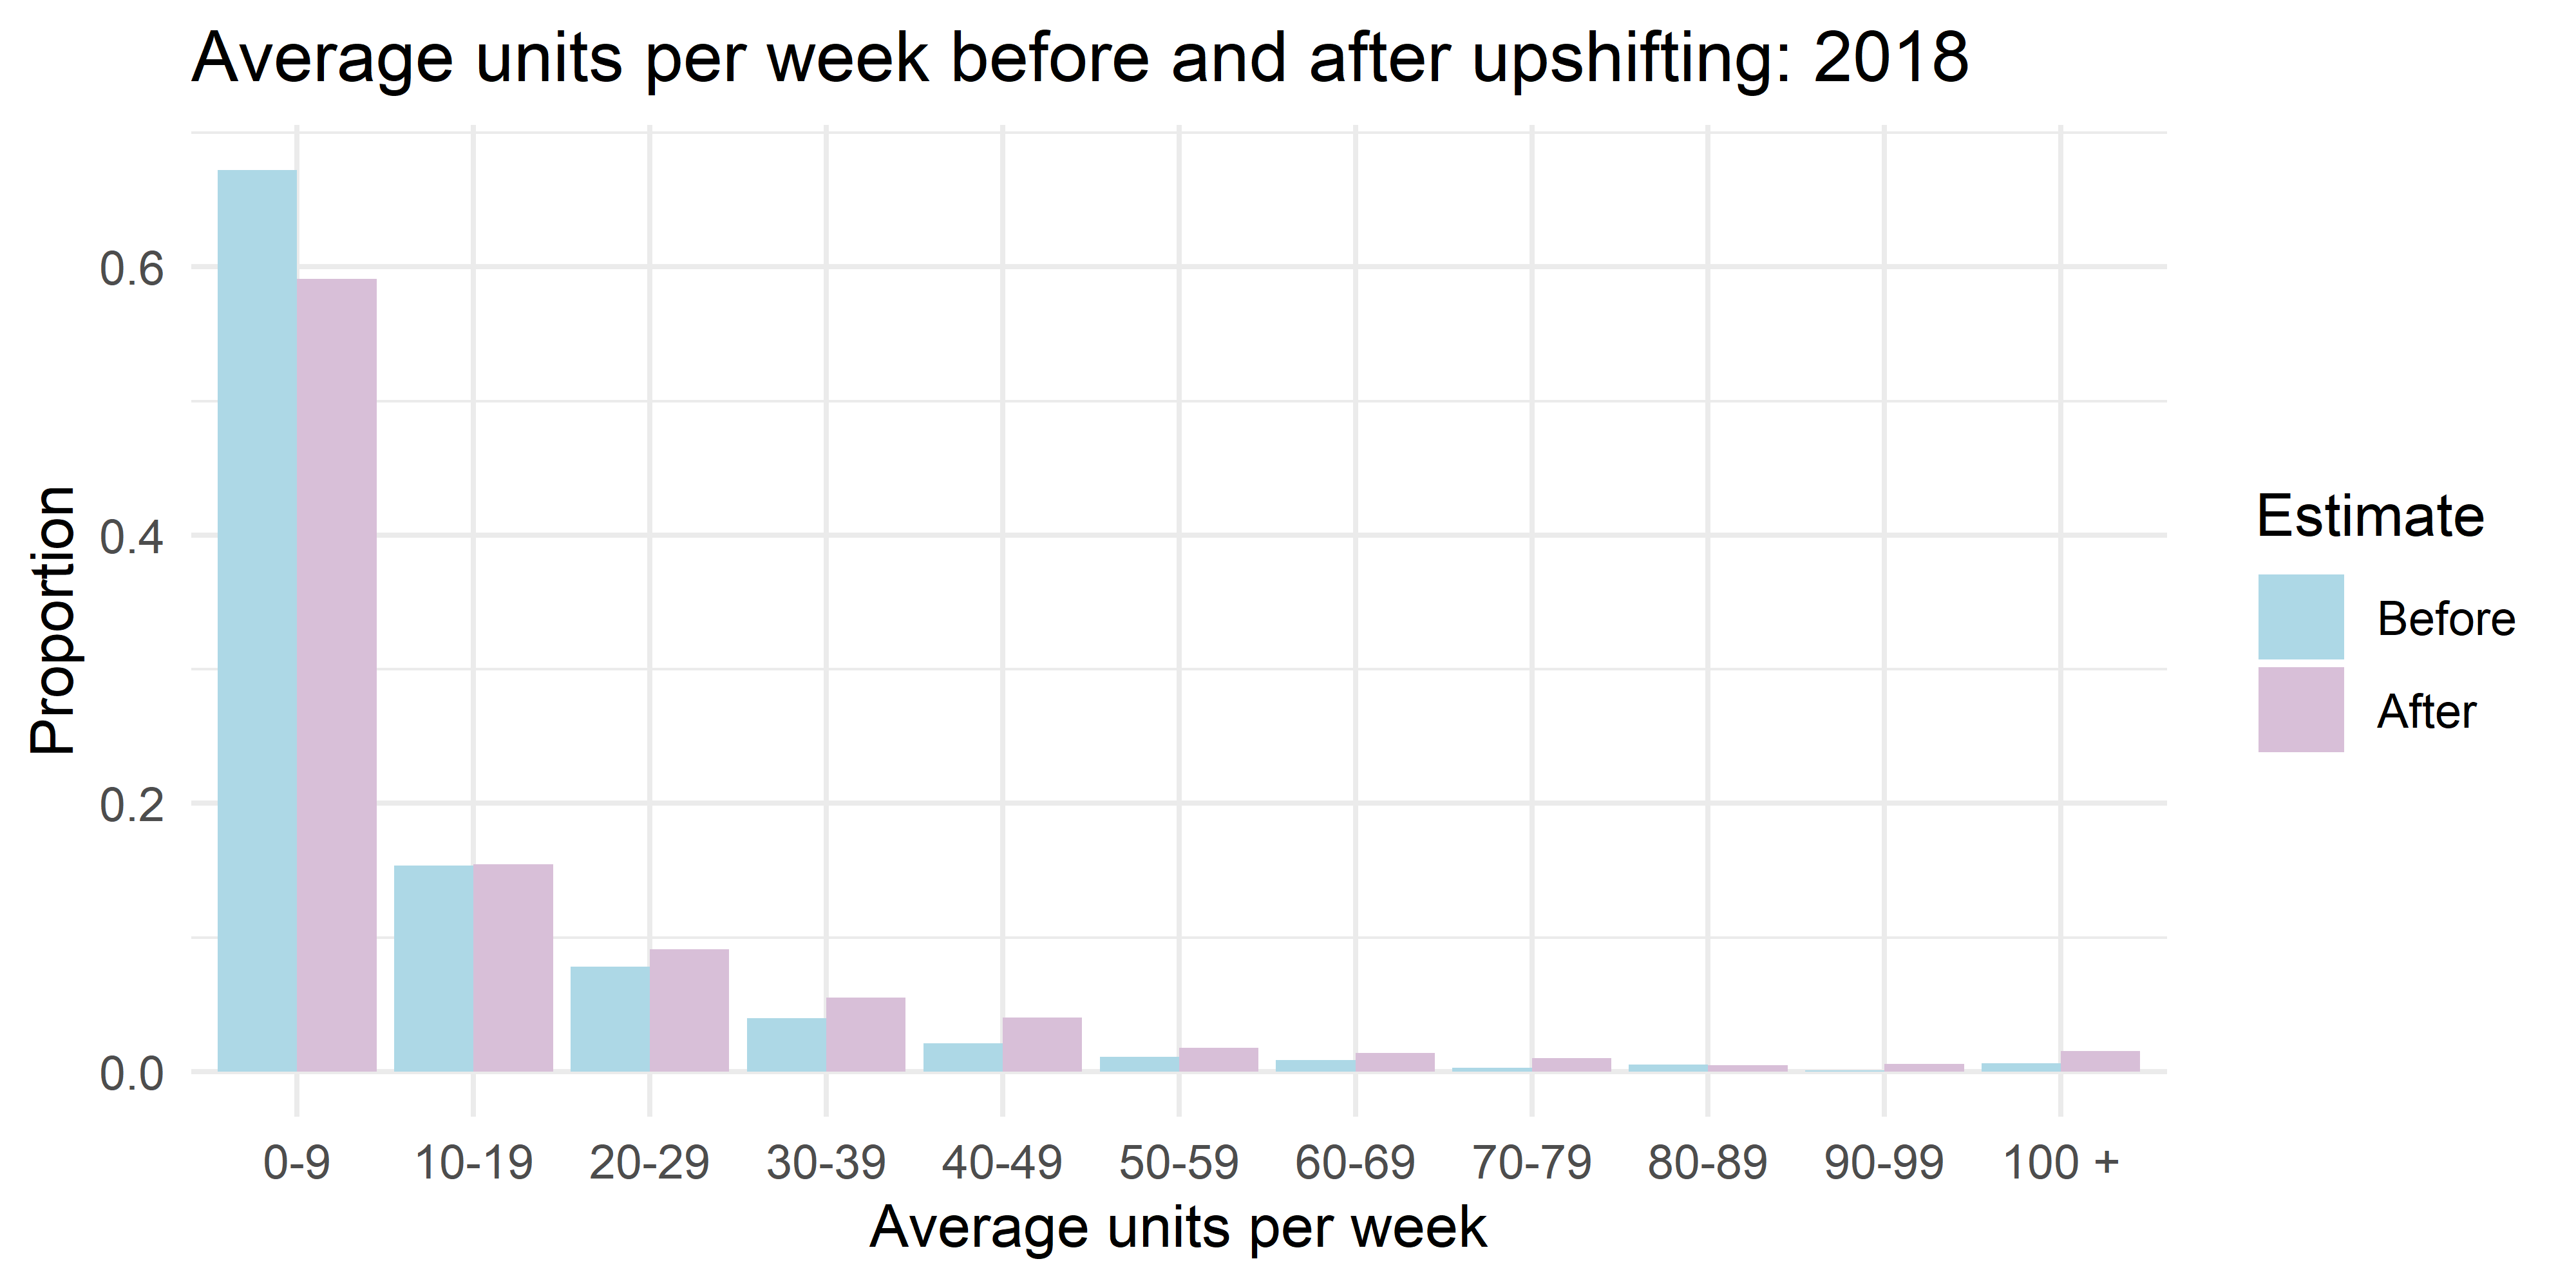
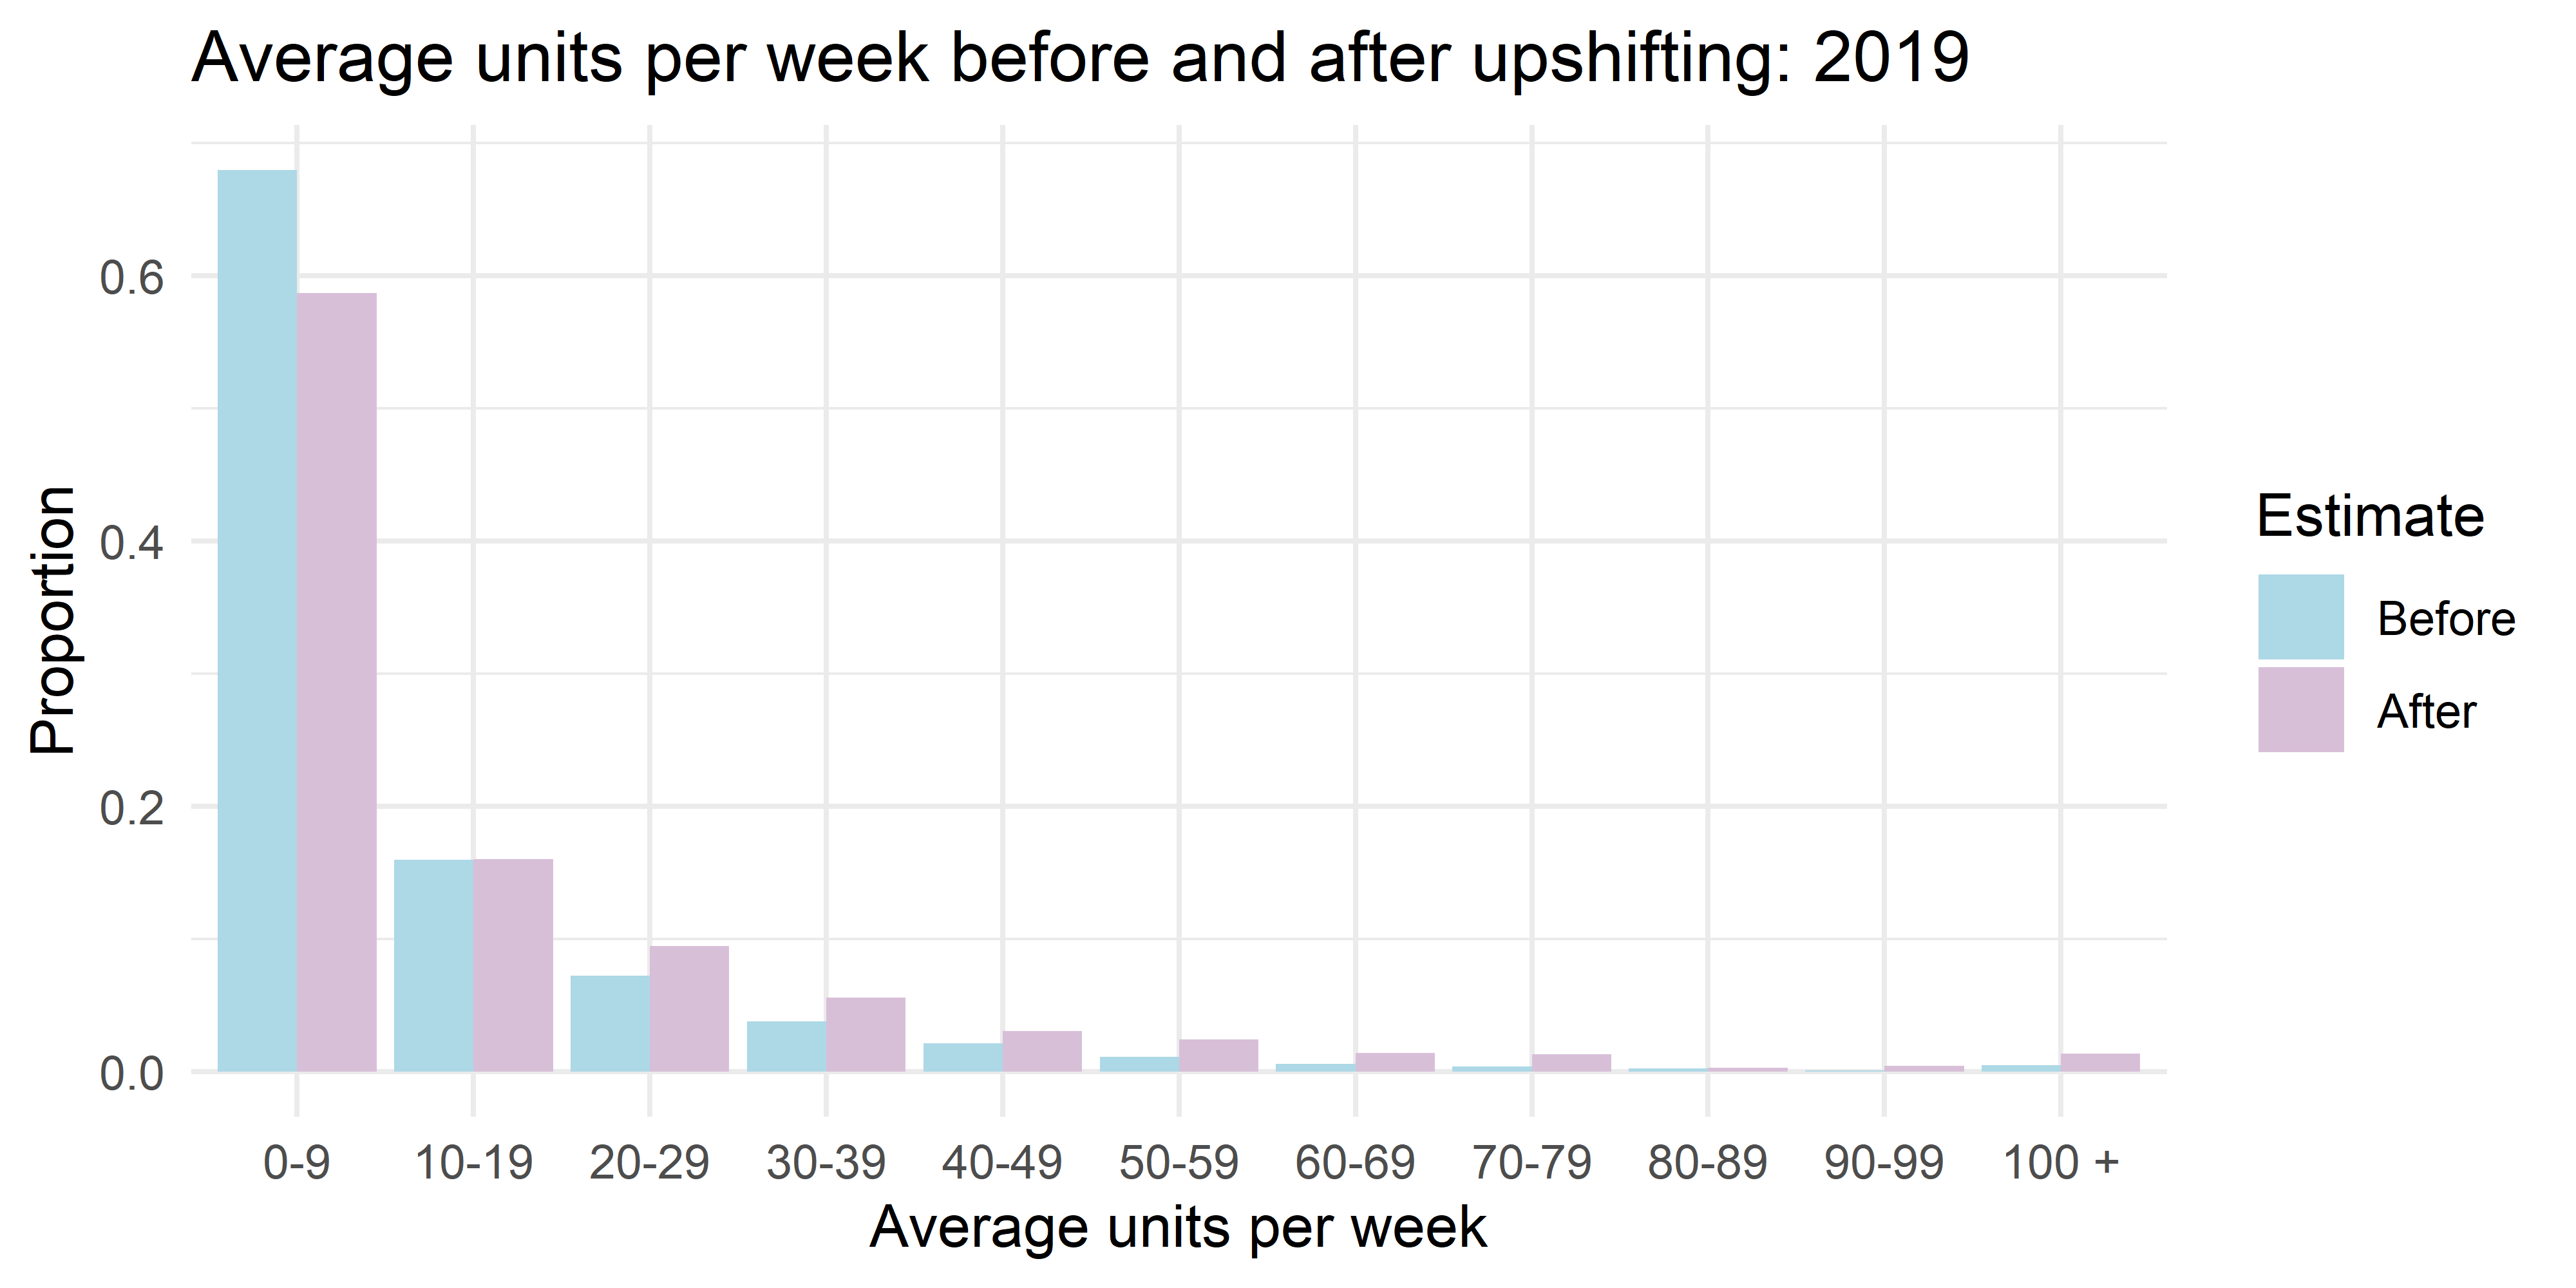
- Distribution of average weekly alcohol consumption (UK standard units) calculated from hseclean for the overall population aged 16 to 89 years, for the years 2015 to 2019, with mean weekly average highlighted. Consumption is capped at 100 units per week.
- Distribution of standardised average weekly alcohol consumption before and after upshifting applied, for the years 2015 to 2019. Consumption is not capped.
Distribution of average weekly alcohol consumption before and after upshifting is applied
2015
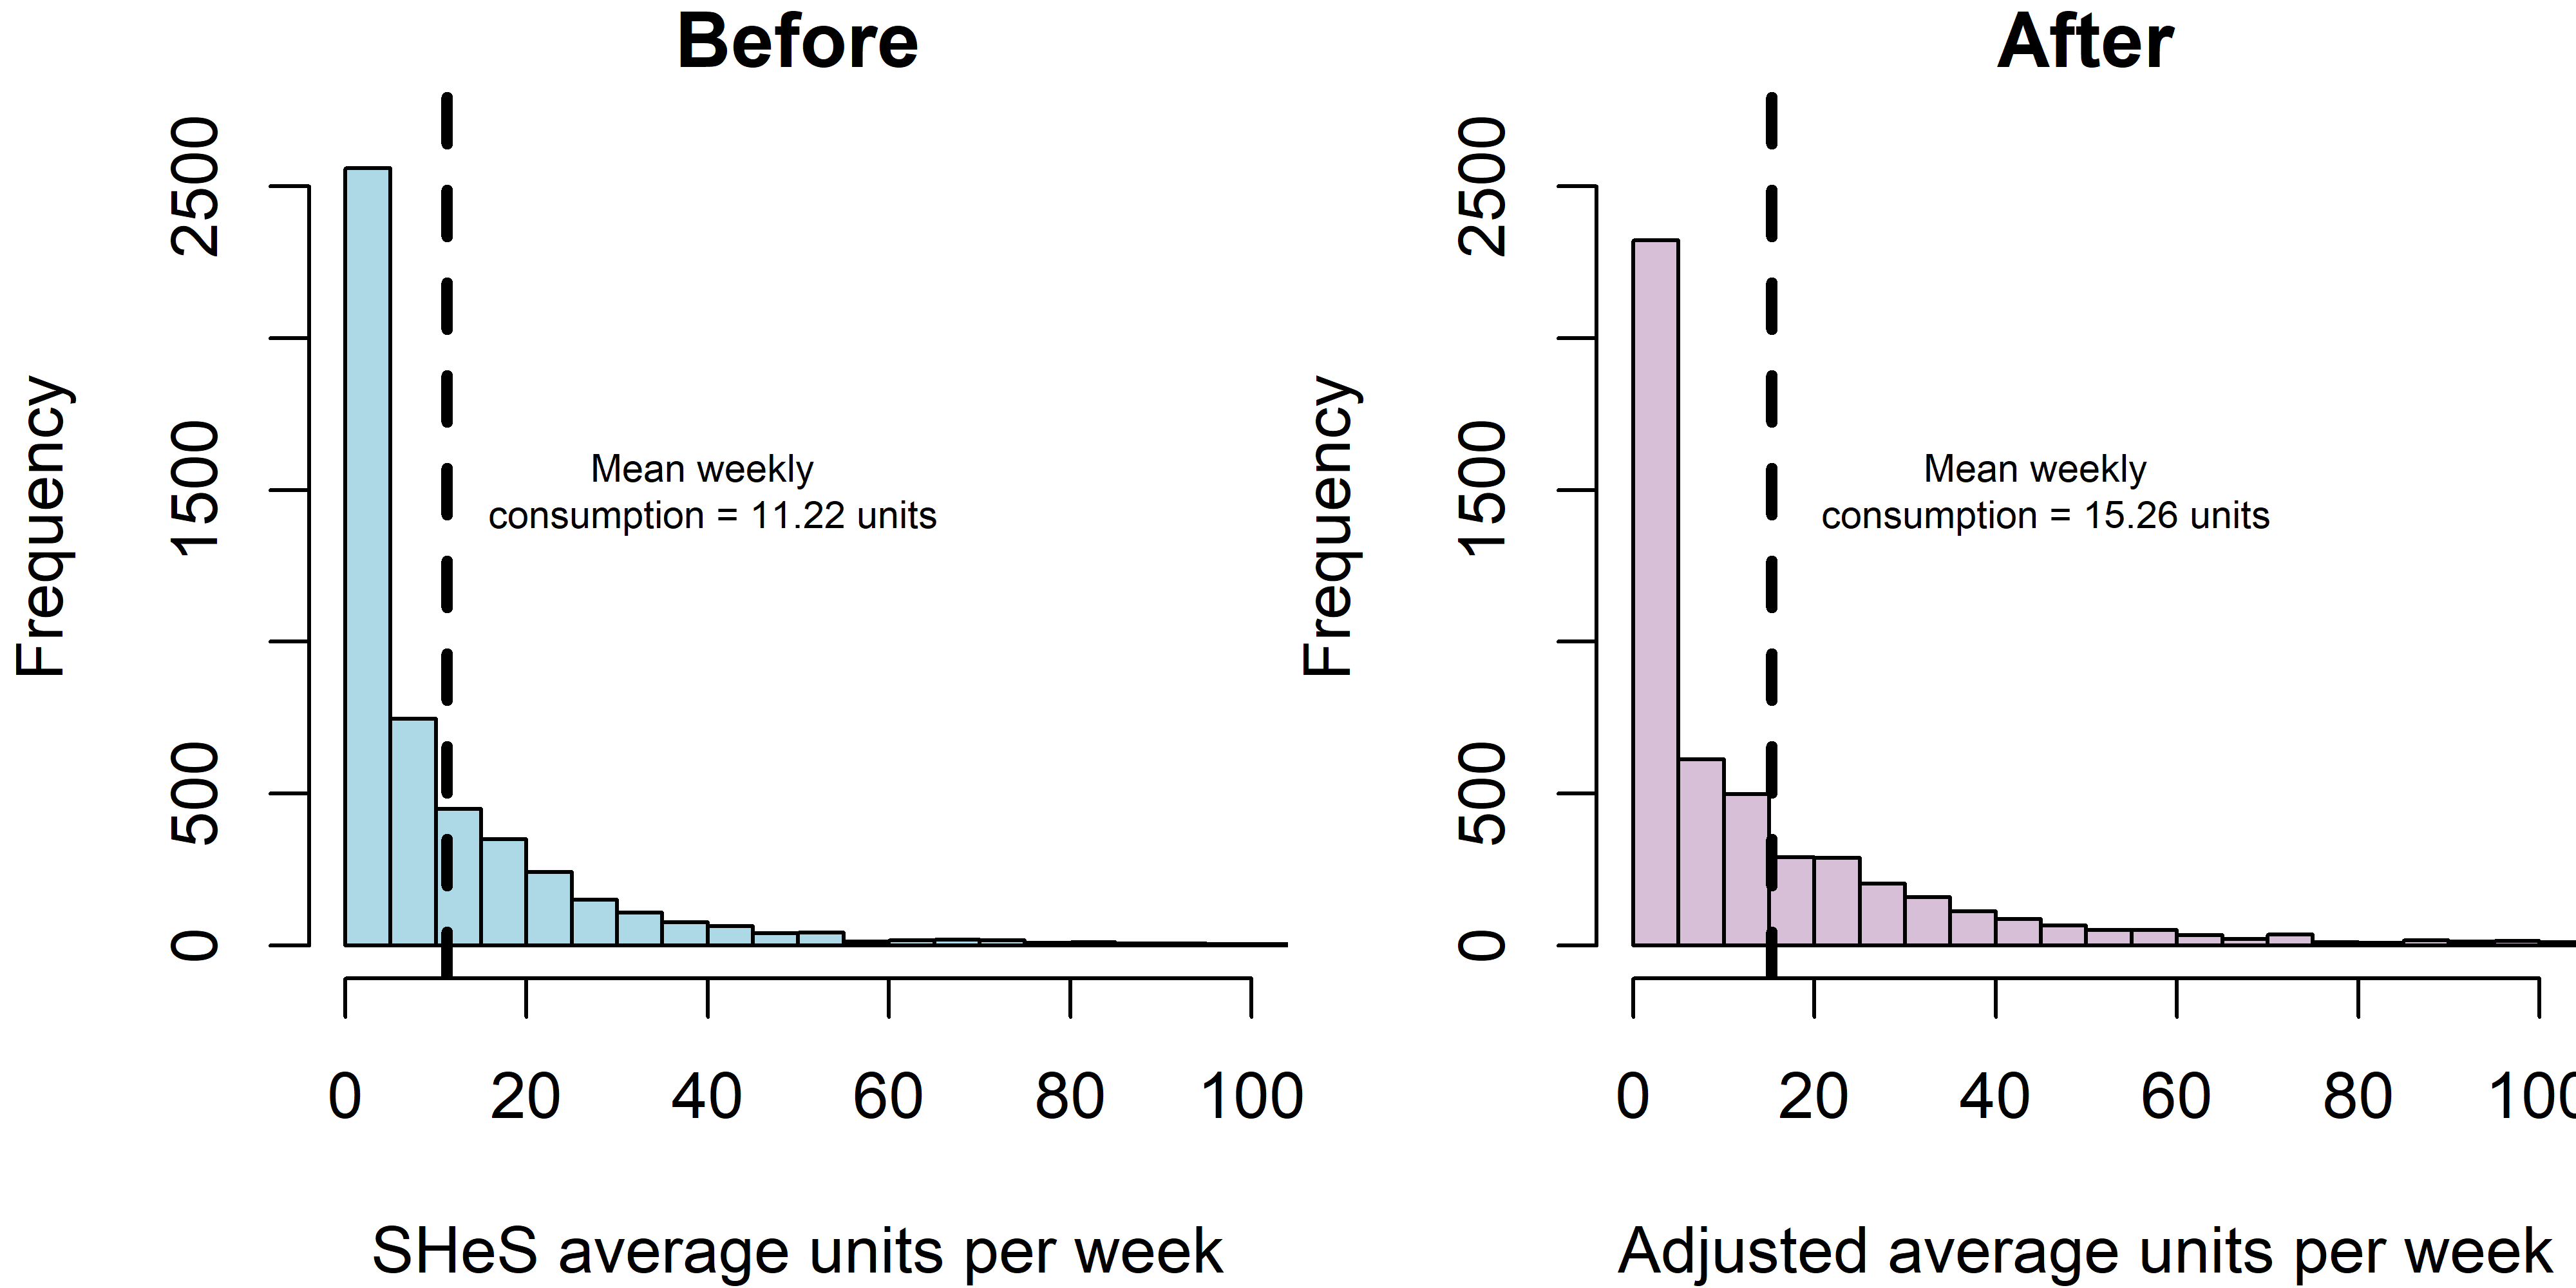
Figure 1. Distribution of 2015 average weekly alcohol consumption calculated from hseclean before and after upshifting applied.
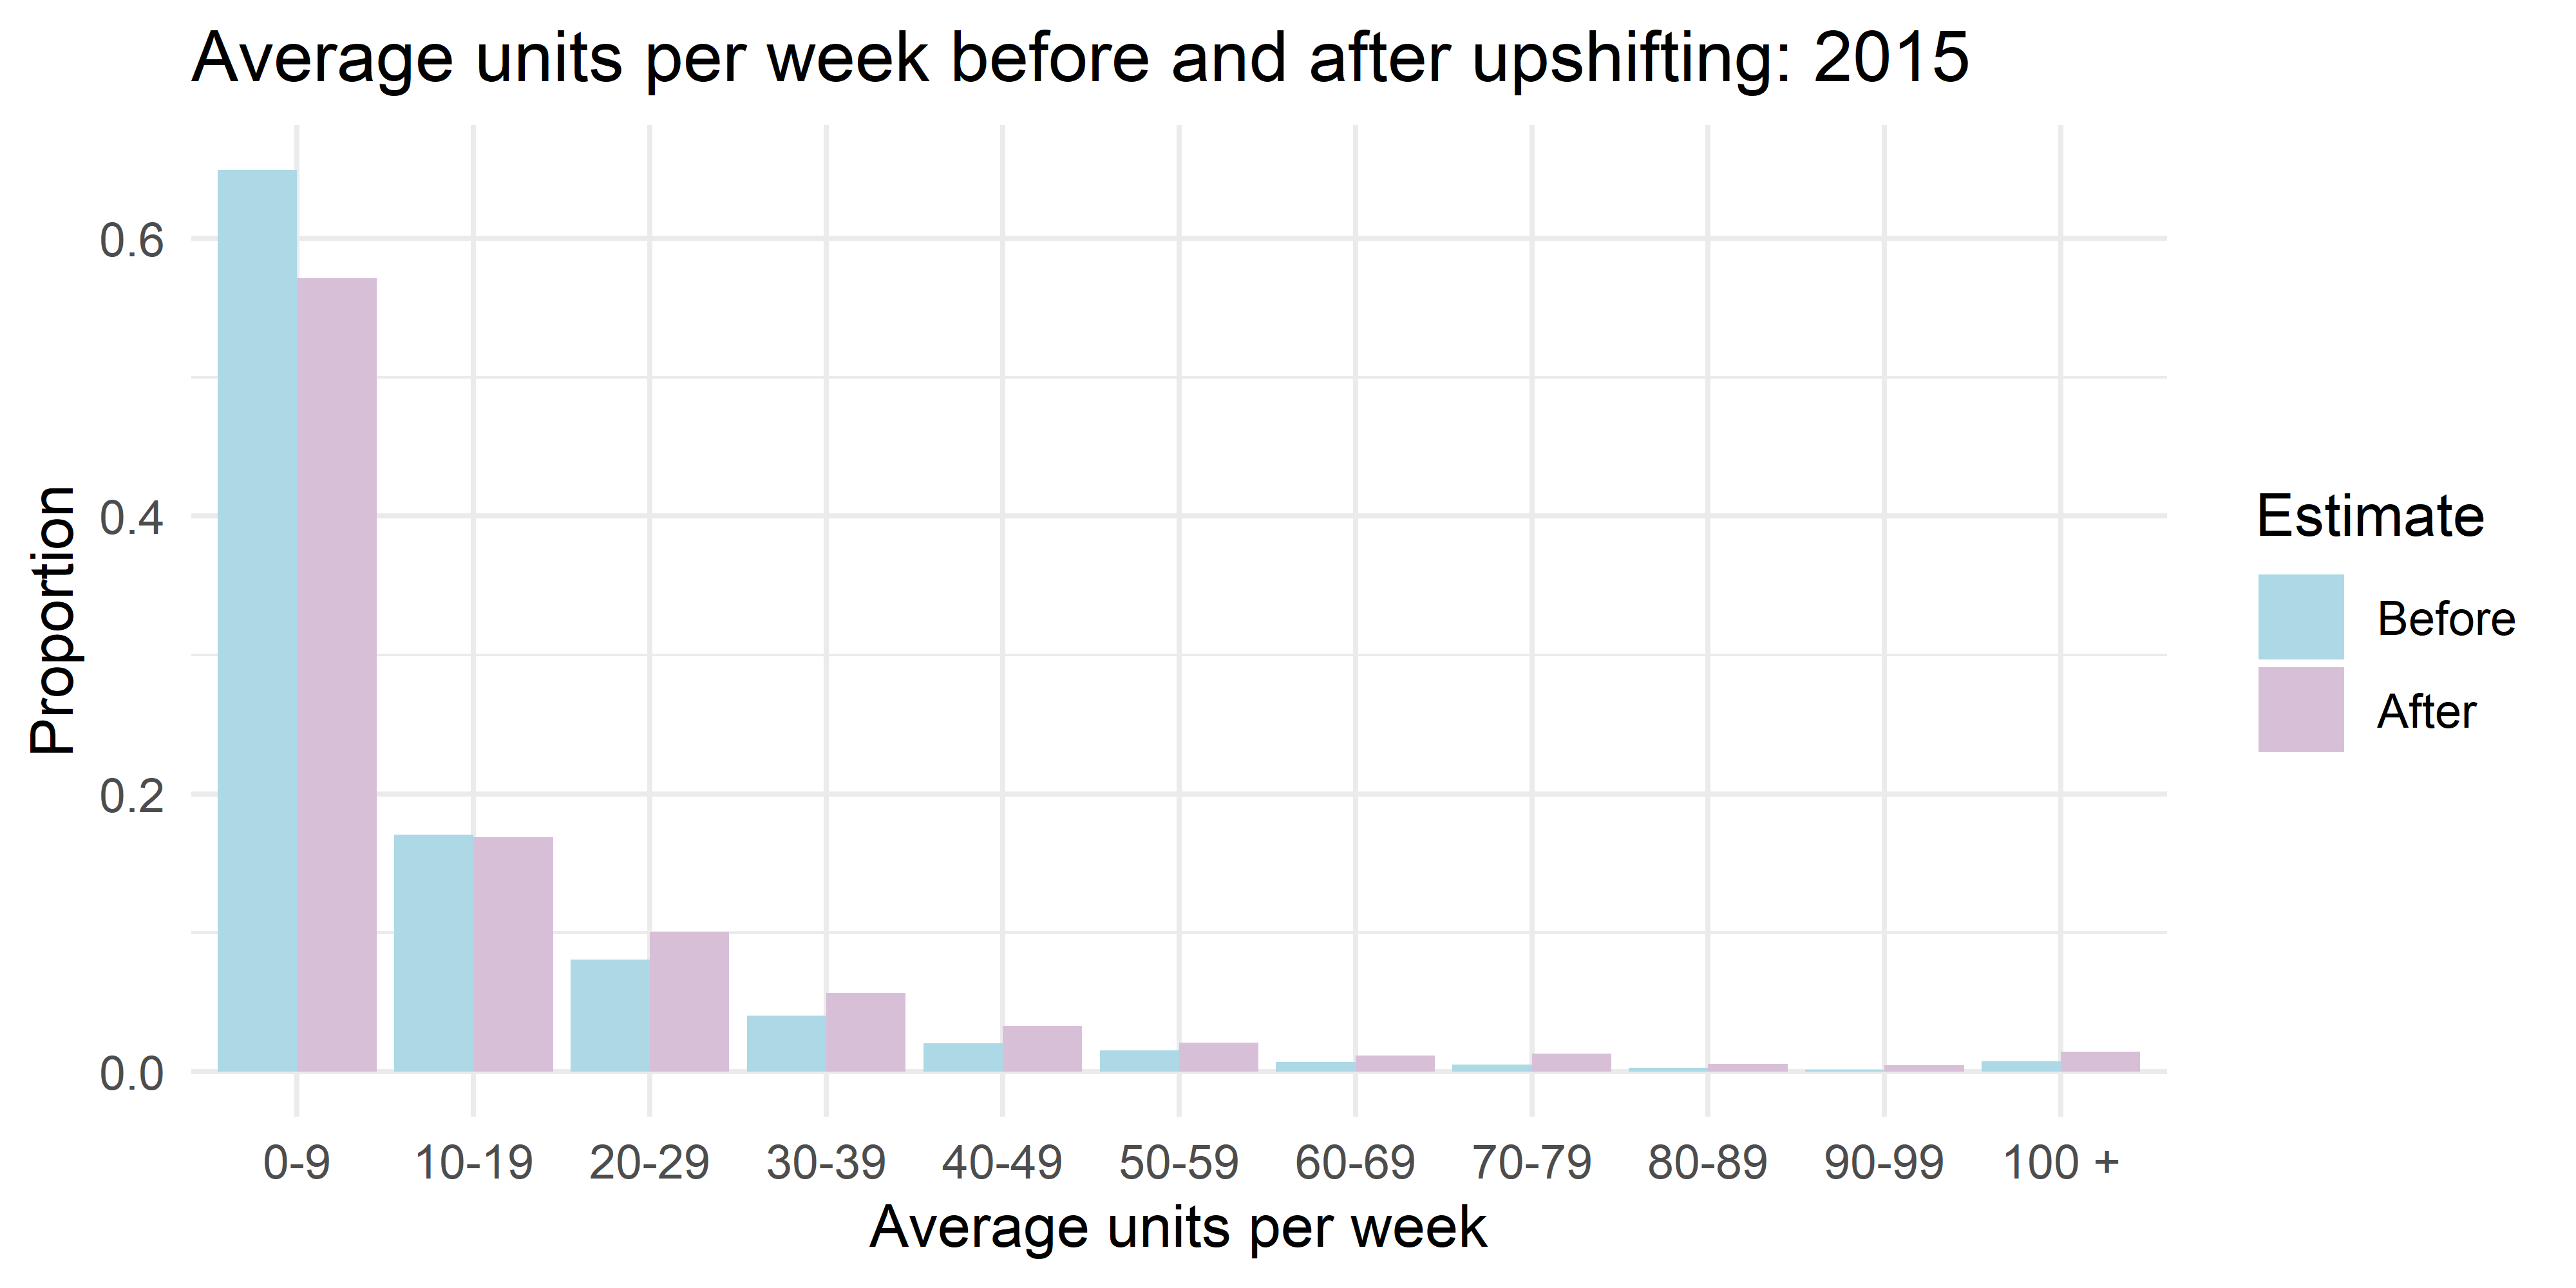
Figure 2. Standardised istribution of 2015 average weekly alcohol consumption calculated from hseclean before and after upshifting applied.
2016
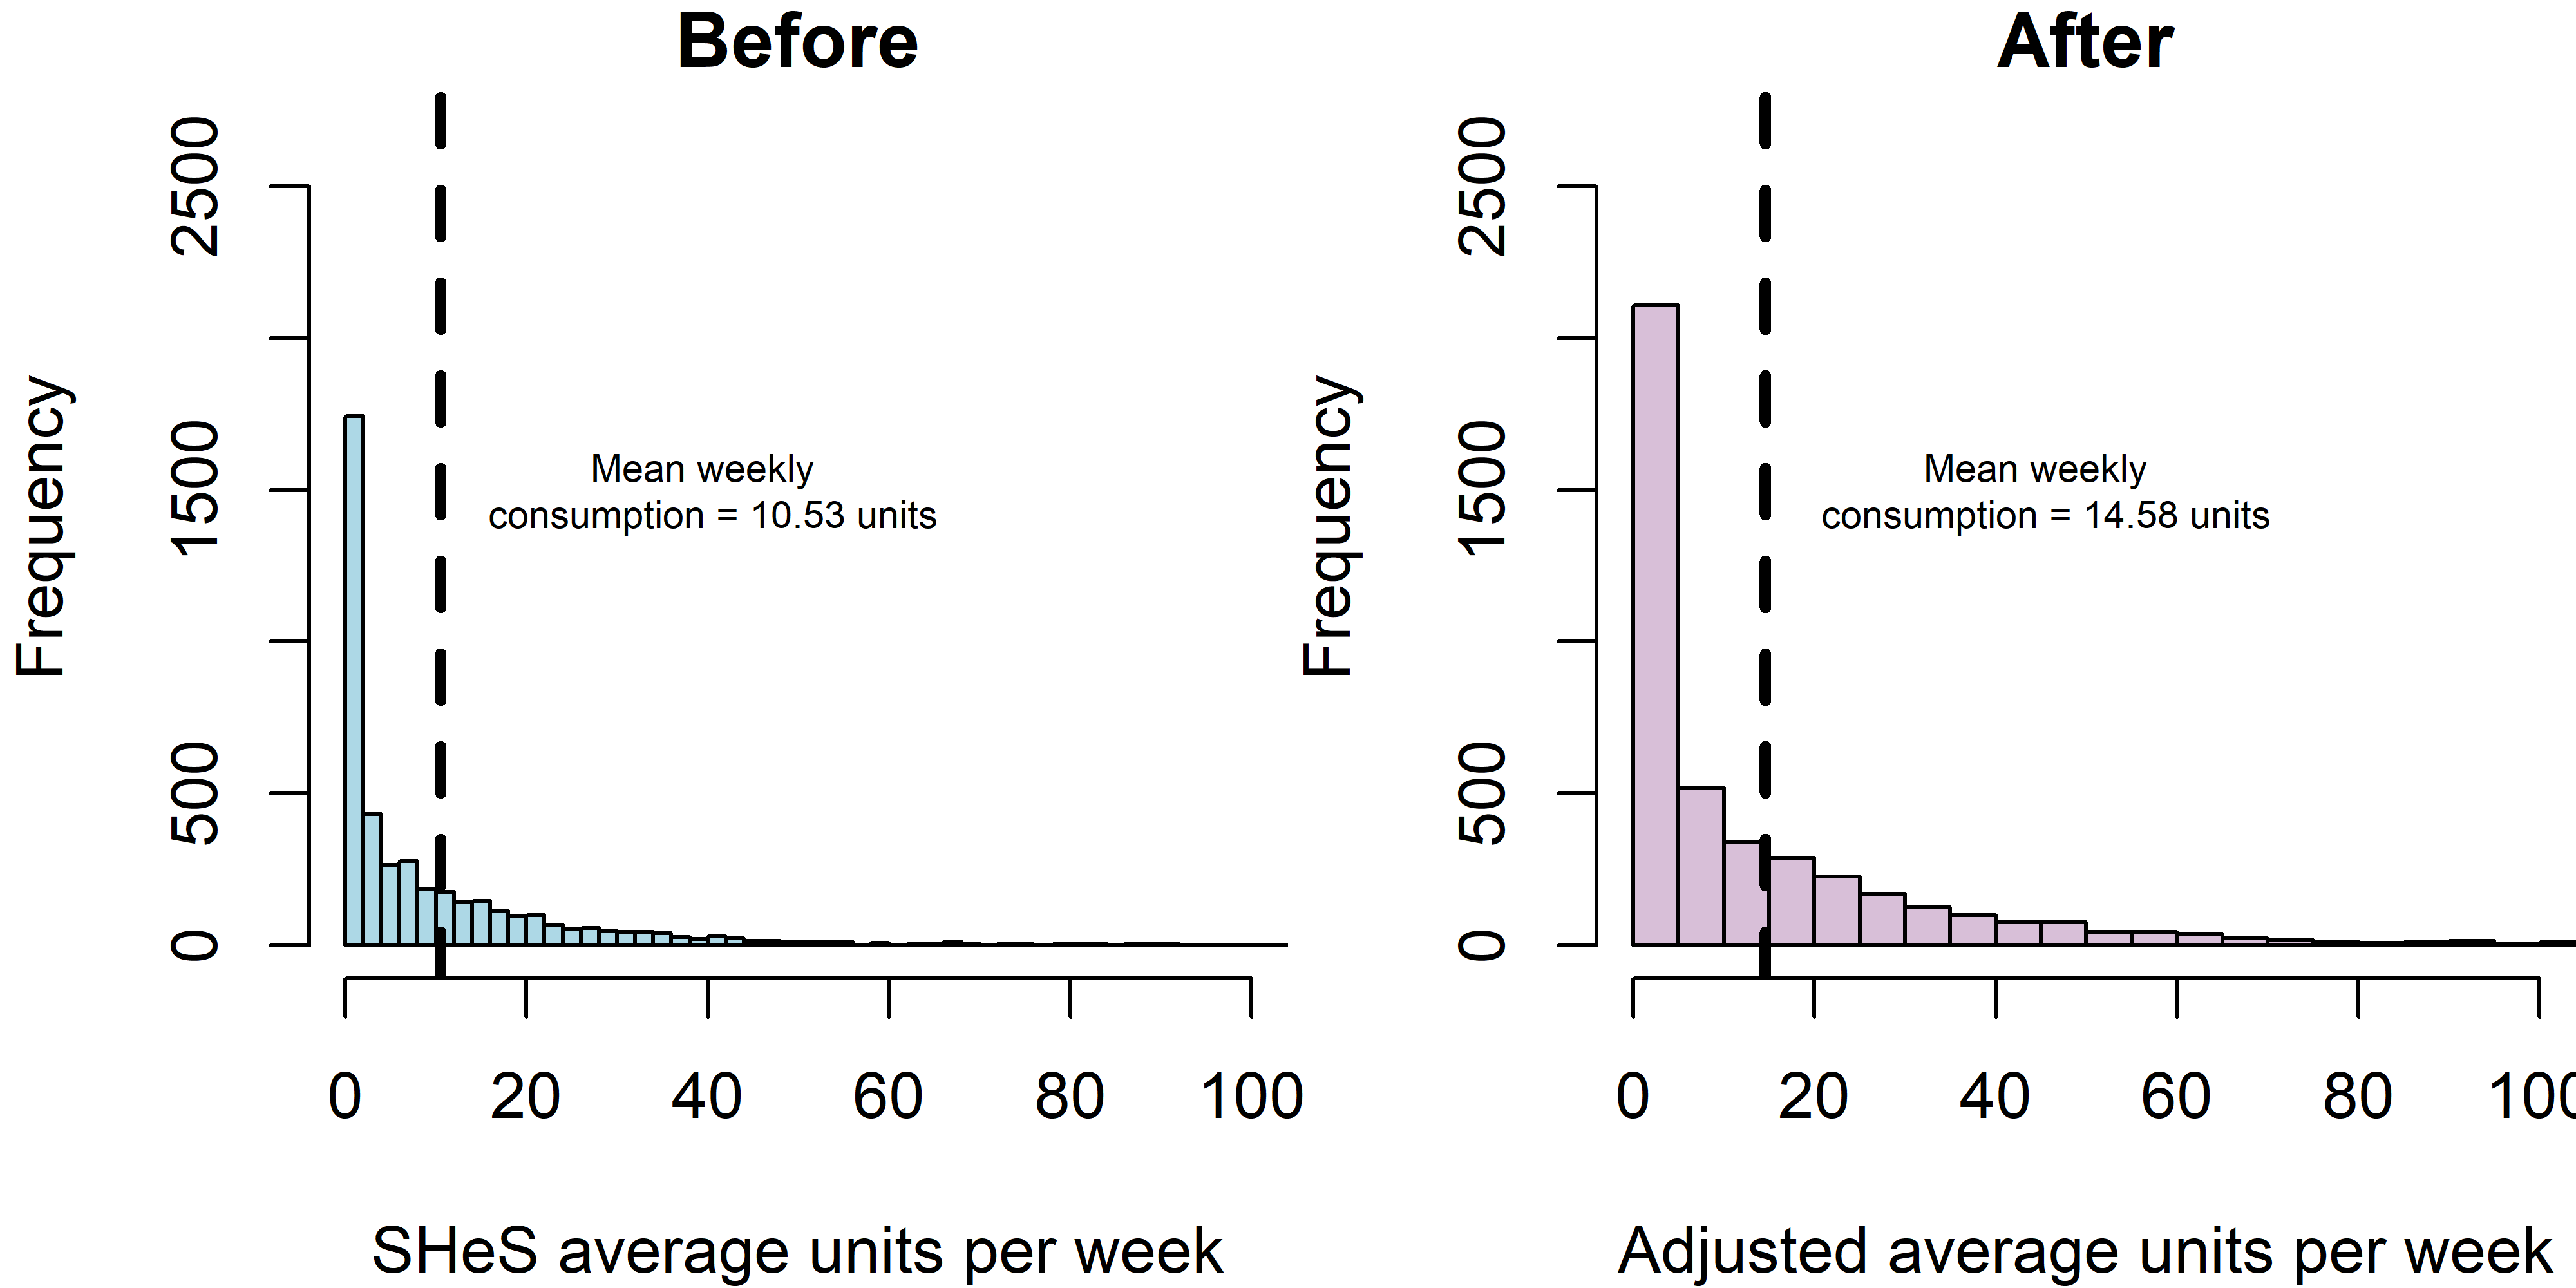
Figure 3. Distribution of 2016 average weekly alcohol consumption calculated from hseclean before and after upshifting applied.

Figure 4. Standardised istribution of 2016 average weekly alcohol consumption calculated from hseclean before and after upshifting applied.
2017
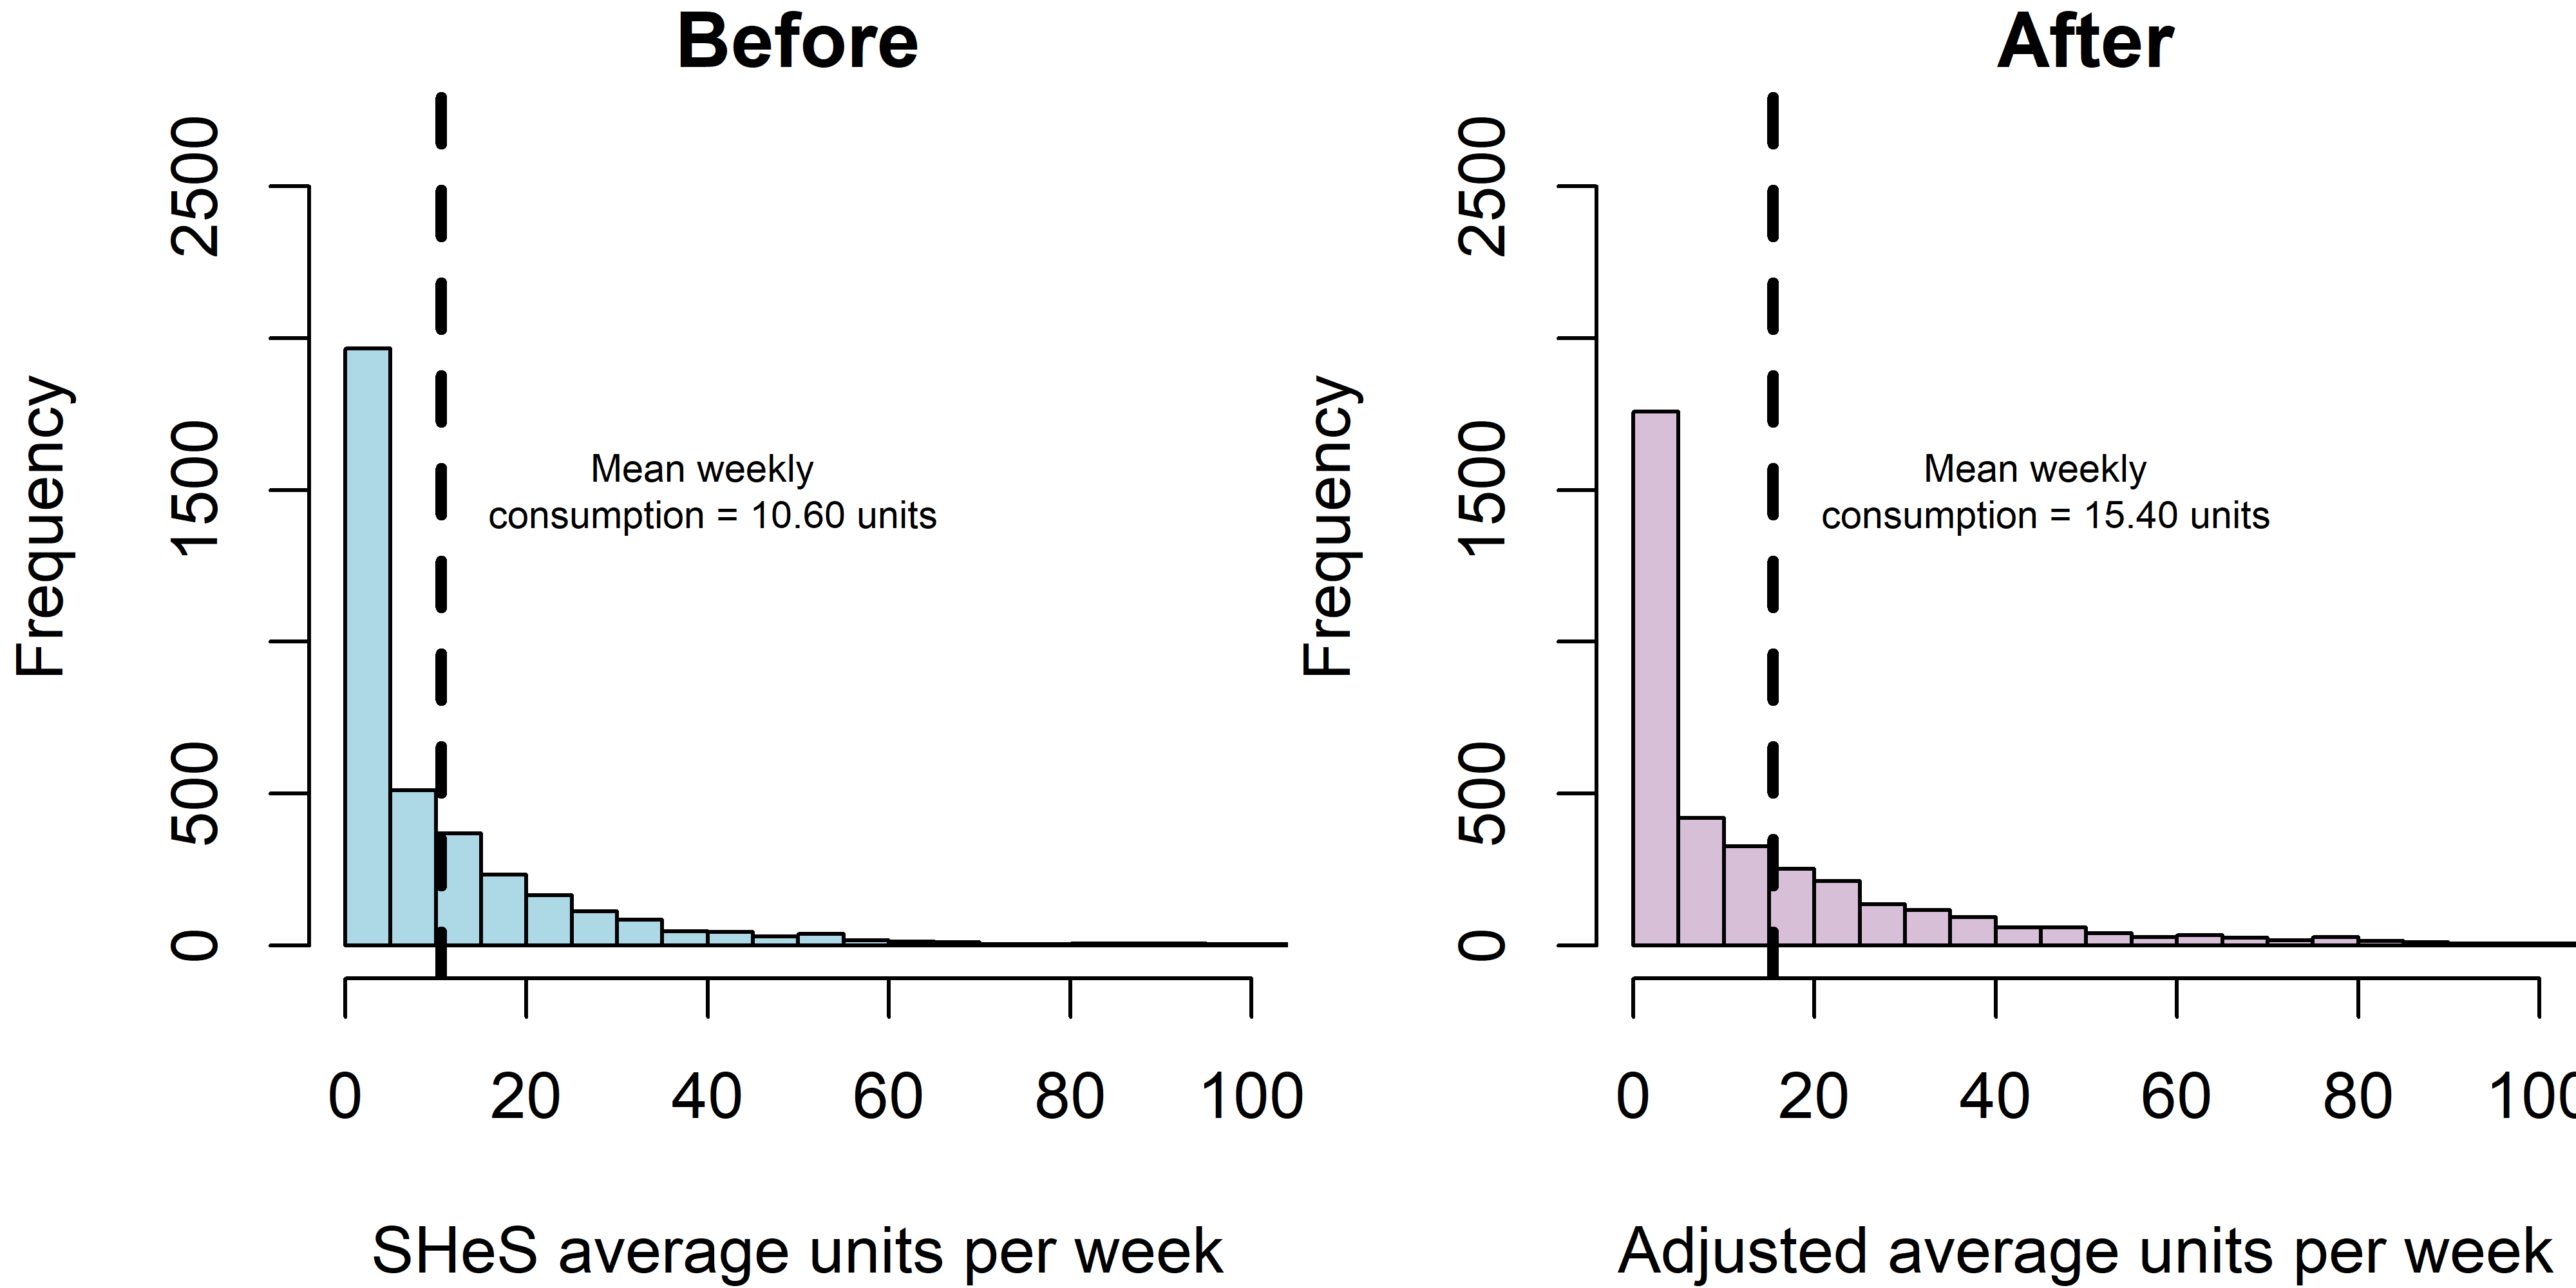
Figure 5. Distribution of 2017 average weekly alcohol consumption calculated from hseclean before and after upshifting applied.

Figure 6. Standardised istribution of 2017 average weekly alcohol consumption calculated from hseclean before and after upshifting applied.


Reproducibility notes
- Data processed using hseclean version 1.11.3 (open access)
- Github code repository https://github.com/STAPM/hseclean. Code for these plots https://github.com/STAPM/hseclean/tree/master/vignettes/Alcohol_upshifting
- Open Science Framework repository https://osf.io/43n7p/